"

2.1 Graphing Quadratic Functions

2.1.1 Prep


Prep for Graphing Quadratic Functions

Match each mathematical notation to a correct definition.

  1. _____________ (0,1)

    _____________ 1

    _____________ x=1

    _____________ x=1

    _____________ (1,0)

    _____________ y=1

    1. A point that is one to the right of the origin
    2. A point that is one above the origin
    3. A vertical line
    4. A possible solution to an equation with variable π‘₯
    5. A horizontal line
    6. The first natural number

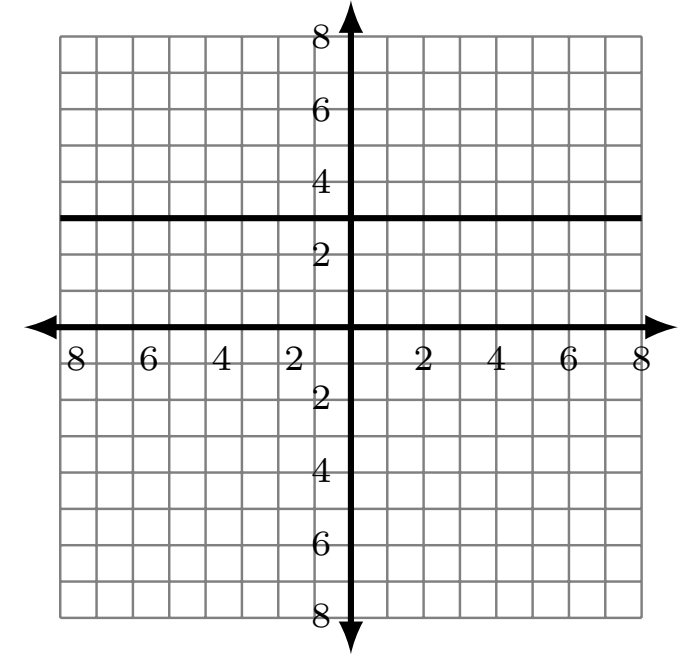
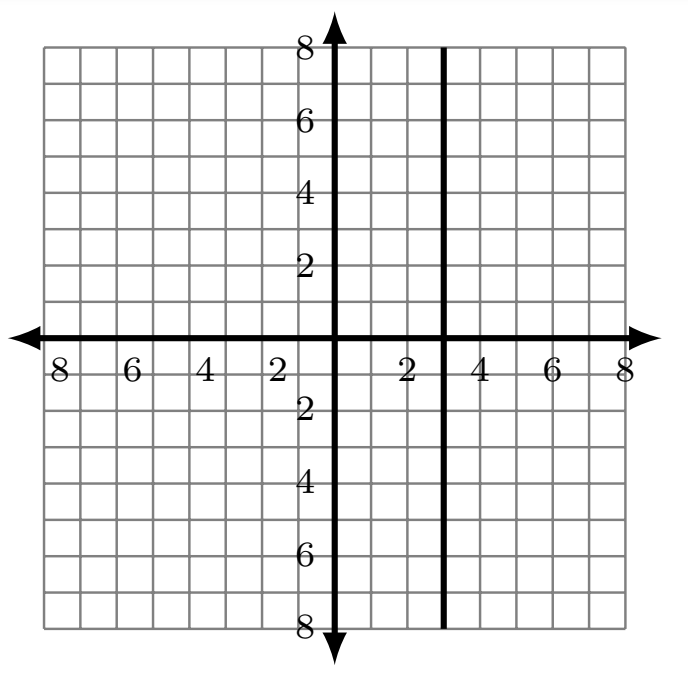
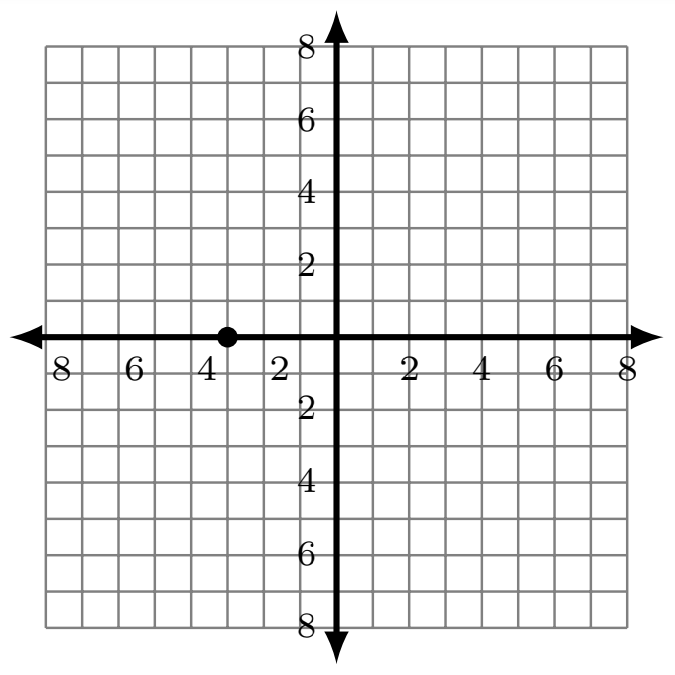
Use the correct notation to define each line or point.

  1. A horizontal black line is drawn on a Cartesian coordinate system with a grid. The x-axis ranges from -8 to 8, and the y-axis ranges from -8 to 8, with integer markings on both axes. The horizontal line intersects the y-axis at the point (0, 3) and extends across the graph.
  2. A vertical black line is drawn on a Cartesian coordinate system with a grid. The x-axis ranges from -8 to 8, and the y-axis ranges from -8 to 8, with integer markings on both axes. The vertical line intersects the x-axis at the point (3, 0) and extends across the graph.
  3. A Cartesian coordinate system is shown with a grid. The x-axis ranges from -8 to 8, and the y-axis ranges from -8 to 8, with integer markings. A single black dot is located on the x-axis at the coordinate (-3, 0).

The Vertex Formula

The following expression will be used to help find the vertex of a quadratic function: [latex]-\frac b{2a}[/latex]

Example


Let a=3 and b=6

[latex]-\frac b{2a}=-\frac6{2\left(3\right)}[/latex]

This formula involves division, and multiplication, and grouping. The fraction bar that separates the numerator from the denominator β€œgroups” the denominator together, so the denominator should be evaluated first.

Evaluate the expression.

[latex]-\frac6{2\left(3\right)}=-\frac66=-1[/latex]

  1. Spot the error!

Two students attempted to evaluate [latex]-\frac8{2\left(4\right)}[/latex] using calculators.

These were their results.

Student A : [latex]-8/2\ast4=-16[/latex]

Student B : [latex]-8/\left(2\ast4\right)=-1[/latex]

Which student is incorrect and what caused their error?

Try It!

Evaluate [latex]-\frac b{2a}[/latex] for each of the following values of a and b.

  1. [latex]a=1,b=8[/latex]
  2. [latex]a=-3,b=-9[/latex]
  3. [latex]a=-2, b=16[/latex]
  4. For the function [latex]f\left(x\right)=-\frac5{2x}[/latex] find
    1. [latex]f\left(3\right)[/latex]
    2. [latex]f\left(-5\right)[/latex]
    3. [latex]f\left(\frac14\right)[/latex]

Example


Find f(2) for the function [latex]f\left(x\right)=3x^2-4x+7[/latex]

[latex]f\left(2\right)=3\left(2\right)^2-4\left(2\right)+7[/latex]

It is important to recall that exponents are evaluated before multiplication when correctly applying the order of operations.

[latex]f(2)=3(2)^2-4(2)+7=3(4)-4(2)+7=12-8+7=4+7=11[/latex]

Also note that addition and subtraction occur at the same time within the order of operations, worked from left to right. So the subtraction [latex]\left(12-8\right)[/latex] takes place before the addition [latex](4+7)[/latex] here.

  1. For the function [latex]g(x)=4x^2+5x+6[/latex] find
    1. [latex]g(3)[/latex]
    2. [latex]g(-1)[/latex]
    3. [latex]g\left(\frac12\right)[/latex]
  2. For the function [latex]h(x)=-x^2-7x-8[/latex] find
    1. [latex]h(2)[/latex]
    2. [latex]h(-1)[/latex]
    3. [latex]h(-4)[/latex]
  3. For the function [latex]f\left(x\right)=-x^2+4x-8[/latex] find
    1. [latex]f(-1)[/latex]
    2. [latex]f\left(\frac34\right)[/latex]
    3. [latex]f\left(-\frac12\right)[/latex]

Answer the following

  1. What is an intercept?
  2. Find the intercepts, and write your answers using the correct notation.
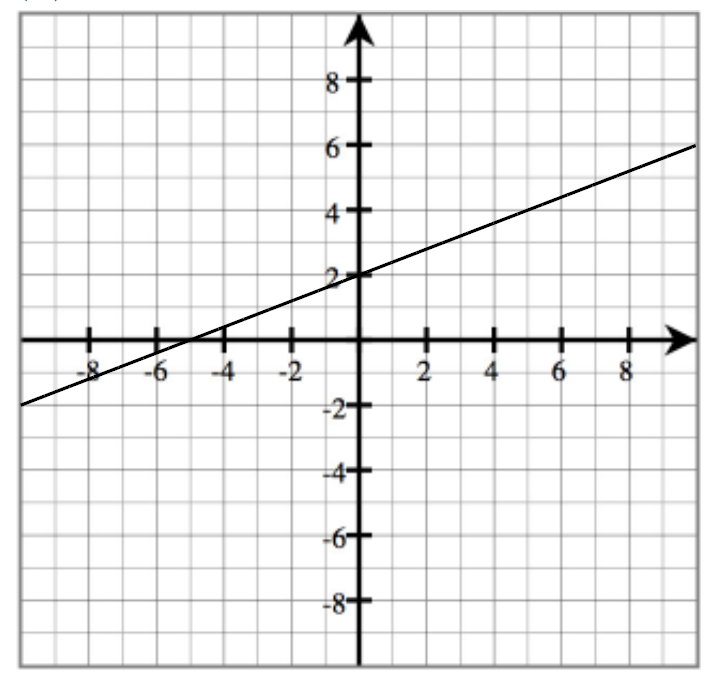
    1. A straight black line is plotted on a Cartesian coordinate system with a grid. The x-axis ranges from -8 to 8, and the y-axis ranges from -8 to 8, with integer markings on both axes. The line intersects the y-axis at approximately (0, 2), x-axis at (-5,0) and has a positive slope.

      y-intercept:_________________
      x-intercept:_________________
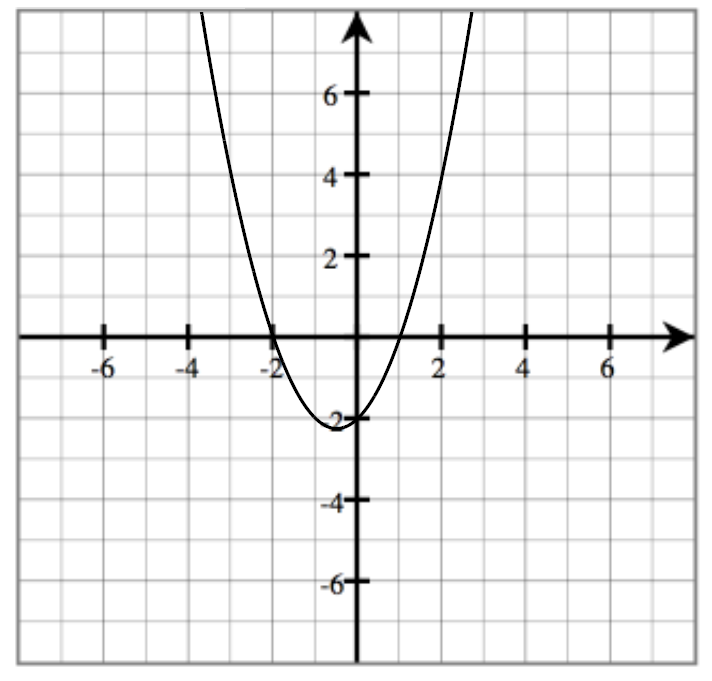
    2. A parabola is graphed on a Cartesian coordinate system. The x-axis ranges from approximately -7 to 7, and the y-axis ranges from approximately -7 to 7, with integer markings. The parabola opens upwards, and passes through the points (-2,0), (0, -2), (1,0) and more.

      y-intercept:__________________
      x-intercepts:_________________

Answer the following.

  1. Are the two expressions equivalent?
    1. [latex]\frac xy+\frac3y[/latex] and [latex]\frac{x+3}y[/latex]
    2. [latex]5+6\div3[/latex] and [latex]\frac{5+6}3[/latex]

Discuss the following

  1. What do the symbols [latex]\infty[/latex] and [latex]-\infty[/latex] mean? Where are they located on a graph? When might these symbols be used?

Plot the following points. Then connect them in order.

  1. [latex](-10,0)[/latex]
  2. [latex](-8,1)[/latex]
  3. [latex](-6,2)[/latex]
  4. [latex](-4,3)[/latex]
  5. [latex](0,5)[/latex]
  6. [latex](4,3)[/latex]
  7. [latex](6,2)[/latex]
  8. [latex](8,1)[/latex]
  9. [latex](10,0)[/latex]
  10. [latex](4,-3)[/latex]
  11. [latex](0,-5)[/latex]
  12. [latex](-4,-3)[/latex]
  13. [latex](-10,0)[/latex]
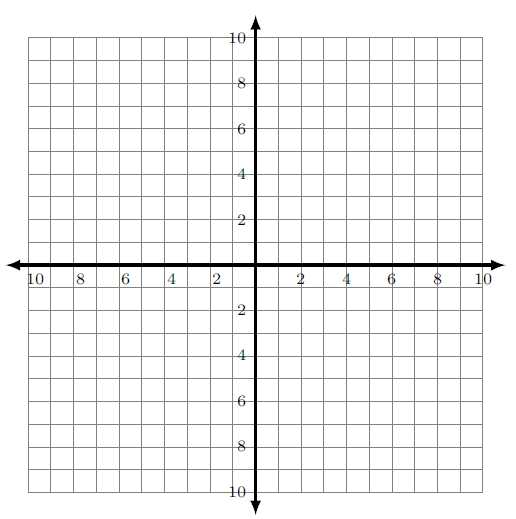
A Cartesian coordinate system is shown with a grid. The horizontal x-axis ranges from -10 to 10, with integer markings. The vertical y-axis also ranges from -10 to 10, with integer markings. The x and y axes intersect at the origin (0, 0).
  1. [latex](-2.5,\;0)[/latex]
  2. [latex](-1.75,\;2)[/latex]
  3. [latex](1.75,\;2)[/latex]
  4. [latex](2\frac12,0)[/latex]
  5. [latex]\left(1\frac34,-2\right)[/latex]
  6. [latex](-1\frac34,-2)[/latex]
  7. [latex](-2.5,0)[/latex]
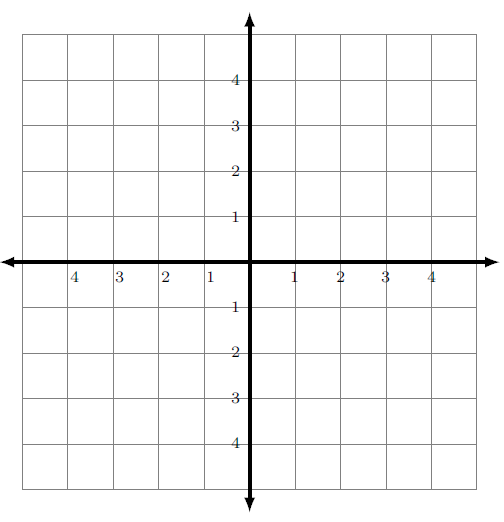
A Cartesian coordinate system is shown with a grid. The horizontal x-axis ranges from -4 to 4, with integer markings. The vertical y-axis also ranges from -4 to 4, with integer markings. The x and y axes intersect at the origin (0, 0).

2.1.2 Preview


Try It!

Graph the function [latex]f\left(x\right)=x[/latex] by completing the table below and plotting points.

x y = x
-3
-2
-1
0
1
2
3
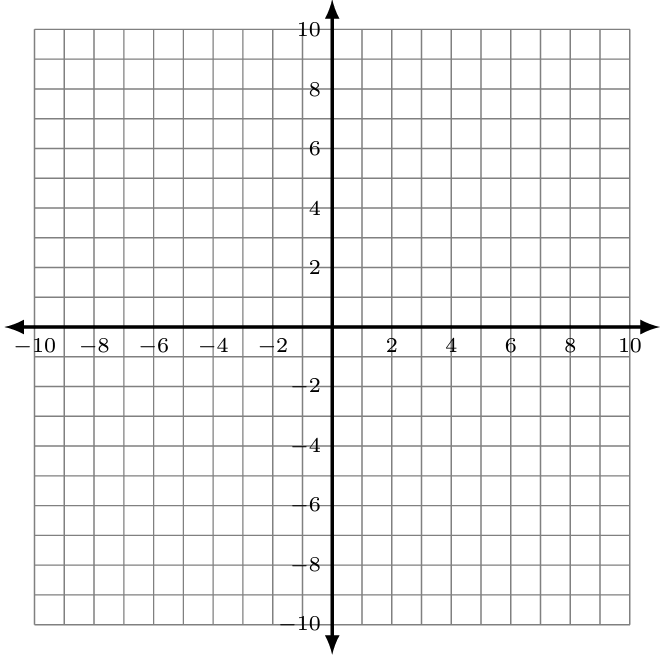
A Cartesian coordinate system is shown with a grid. The horizontal x-axis ranges from -10 to 10, with integer markings. The vertical y-axis also ranges from -10 to 10, with integer markings. The x and y axes intersect at the origin (0, 0).

Try It!

Graph the function [latex]g\left(x\right)=x^2[/latex] by completing the table below and plotting points.

x [latex]{\color[rgb]{1.0, 1.0, 1.0}\boldsymbol y}{\color[rgb]{1.0, 1.0, 1.0}\mathbf=}{\color[rgb]{1.0, 1.0, 1.0}\boldsymbol x}^{\color[rgb]{1.0, 1.0, 1.0}\mathbf2}[/latex]
-3
-2
-1
0
1
2
3
A Cartesian coordinate system is shown with a grid. The horizontal x-axis ranges from -10 to 10, with integer markings. The vertical y-axis also ranges from -10 to 10, with integer markings. The x and y axes intersect at the origin (0, 0).

Describe the differences between the shape of the graphs for f and g above

Try It!

Graph the function [latex]h\left(x\right)=x^2-4[/latex] by completing the table below and plotting points.

x [latex]{\color[rgb]{1.0, 1.0, 1.0}\boldsymbol y}{\color[rgb]{1.0, 1.0, 1.0}\mathbf=}{\color[rgb]{1.0, 1.0, 1.0}\boldsymbol x}^{\color[rgb]{1.0, 1.0, 1.0}\mathbf2}{\color[rgb]{1.0, 1.0, 1.0}\mathbf-}{\color[rgb]{1.0, 1.0, 1.0}\mathbf4}[/latex]
-3
-2
-1
0
1
2
3
A Cartesian coordinate system is shown with a grid. The horizontal x-axis ranges from -10 to 10, with integer markings. The vertical y-axis also ranges from -10 to 10, with integer markings. The x and y axes intersect at the origin (0, 0).

Try It!

How does the graph of [latex]h\left(x\right)=x^2-4[/latex] compare to the graph of [latex]g\left(x\right)=x^2[/latex]?

2.1.3 Classwork


A quadratic function is of the form [latex]f(x)=ax^2+bx+c[/latex], where [latex]a\neq0[/latex]. The graph of a quadratic function is called a parabola.

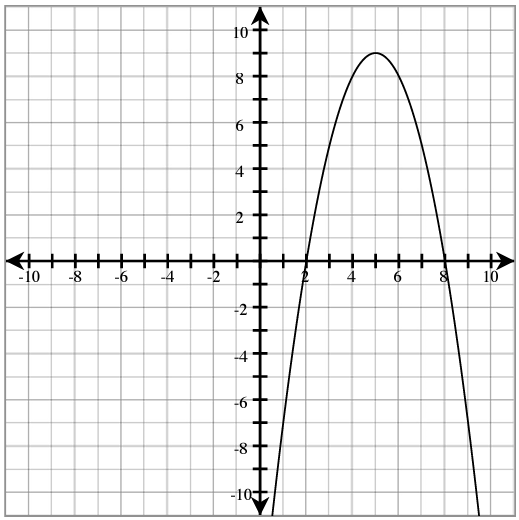
For each parabola below, label the following: vertex, axis of symmetry, y-intercept, x-intercepts, and max (or min).
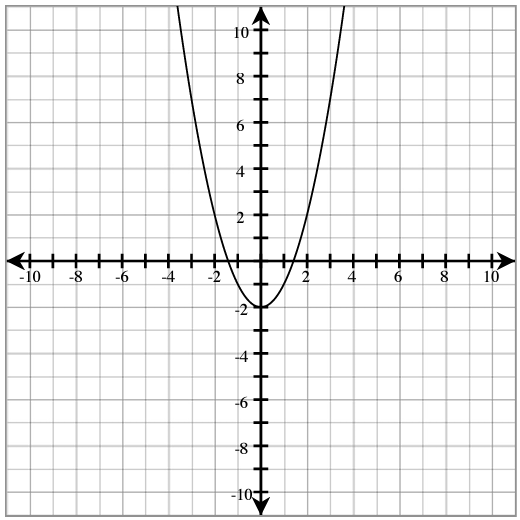
A parabola is graphed on a Cartesian coordinate system. The x-axis ranges from -10 to 10, and the y-axis ranges from -10 to 10, with integer markings. The parabola opens upwards, intersects x-axis at (-1.5,0) and (1.5,0) with its lowest point (0, -2).
A parabola is graphed on a Cartesian coordinate system. The x-axis ranges from -10 to 10, and the y-axis ranges from -10 to 10, with integer markings. The parabola opens downwards, intersects x-axis at (2,0) and (8,0) with its highest point (5, 9).

The parabola opens up if ________________. The parabola opens down if ________________.

The axis of symmetry (line of symmetry): x = ________________.

To find the y-intercept:

Sketch three different examples of a parabola that has two, one, or no x-intercepts.

Find the x-intercept(s) by solving [latex]f\left(x\right)=0[/latex]. We will learn how to solve such equations in later sections.

Domain:

Range:

Use the vertex and whether the graph opens up or down to determine the number of x-intercepts. Sketch the graph.

  1. [latex]f\left(x\right)=x^2+5x+4[/latex]
  2. [latex]f\left(x\right)=x^2-3x+10[/latex]
  3. [latex]f\left(x\right)=-x^2+10x-25[/latex]

Use these graphs to answer the questions below.

Graph A Graph B
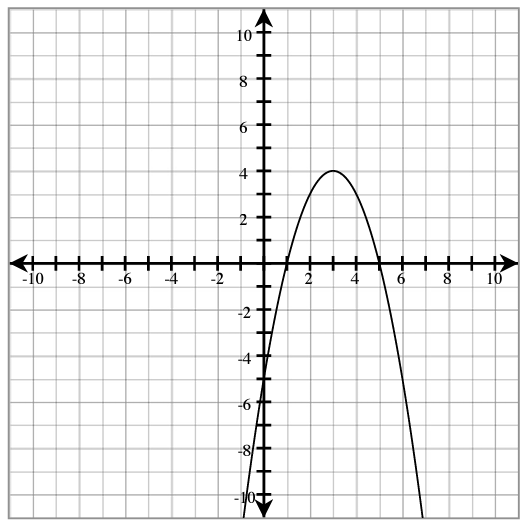
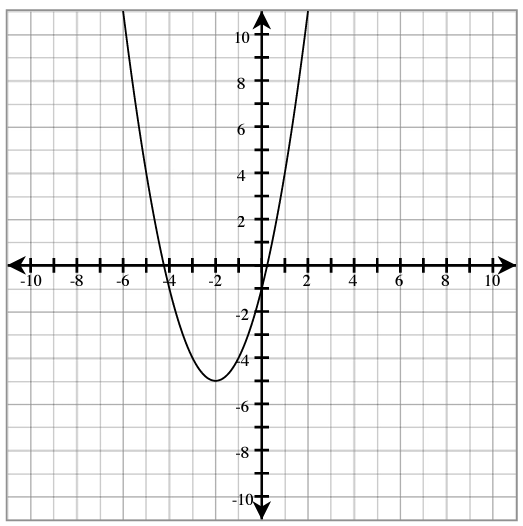
A parabola is graphed on a Cartesian coordinate system. The x-axis ranges from -10 to 10, and the y-axis ranges from -10 to 10, with integer markings. The parabola opens downwards, reaching its peak at (3,4) in the first quadrant and intersecting the x-axis at (1,0) and (5,0). This parabola also intersect y-axis at (0,-5). A parabola is graphed on a Cartesian coordinate system. The x-axis ranges from -10 to 10, and the y-axis ranges from -10 to 10, with integer markings. The parabola opens upwards, with its lowest point at (-2, -5). It crosses the x-axis at two distinct points. This parabola also intersect y-axis at (0, -1).
  1. What is the axis of symmetry for Graph A?
  2. What is the vertex of Graph A?
  3. Does this vertex give a maximum or minimum?
  4. Identify the domain and range of Graph A.
  5. Identify the y-intercept of Graph A.
  6. Explain how (6, -5) is related to your answer for v.
  1. What is the axis of symmetry for Graph B?
  2. What is the vertex of Graph B?
  3. Does this vertex give a maximum or minimum?
  4. Identify the domain and range of Graph B.
  5. Identify the y-intercept of Graph B.
  6. Explain how (-4, -1) is related to your answer for v.

Sketch the graph and identify the following characteristics for each function.

  1. [latex]f\left(x\right)=x^2-6x+13[/latex]

    Opens: Up/ Down

    Axis of symmetry:

    Vertex:

    y-intercept:

    Number of x-intercept(s):

    Domain:

    Range:
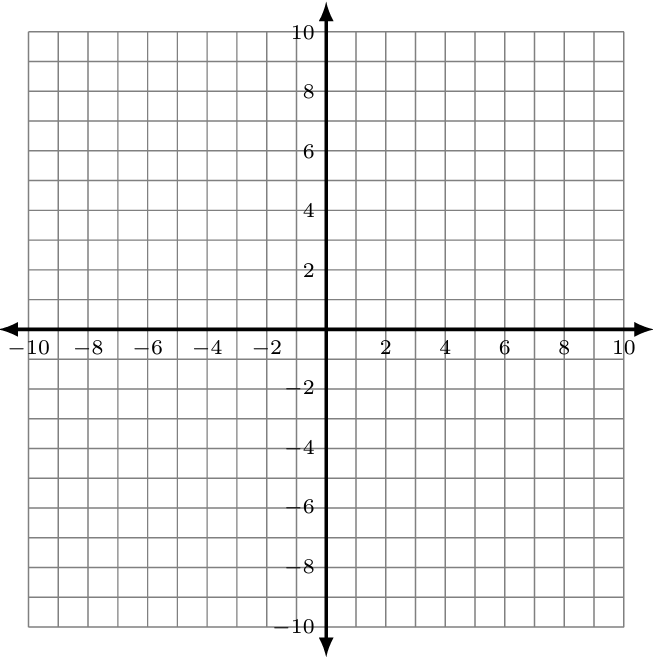
    A Cartesian coordinate system is shown with a grid. The horizontal x-axis ranges from -10 to 10, with integer markings. The vertical y-axis also ranges from -10 to 10, with integer markings. The x and y axes intersect at the origin (0, 0).

  2. [latex]f\left(x\right)=-x^2-2x-1[/latex]

    Opens: Up/ Down

    Axis of symmetry:

    Vertex:

    y-intercept:

    Number of x-intercept(s):

    Domain:

    Range:

    A Cartesian coordinate system is shown with a grid. The horizontal x-axis ranges from -10 to 10, with integer markings. The vertical y-axis also ranges from -10 to 10, with integer markings. The x and y axes intersect at the origin (0, 0).

Find another point to plot using the y-intercept. Find its mirror image across the axis of symmetry.

  1. [latex]g\left(x\right)=-x^2+4x+3[/latex]

    Opens: Up/ Down

    Axis of symmetry:

    Vertex:

    y-intercept:

    Number of x-intercept(s):

    Domain:

    Range:

    A Cartesian coordinate system is shown with a grid. The horizontal x-axis ranges from -10 to 10, with integer markings. The vertical y-axis also ranges from -10 to 10, with integer markings. The x and y axes intersect at the origin (0, 0).

Find another point to plot using the y-intercept. Find its mirror image across the axis of symmetry.

  1. [latex]\normalsize g(x)=-3x^2-30x-82[/latex]

    Opens: Up/ Down

    Axis of symmetry:

    Vertex:

    y-intercept:

    Number of x-intercept(s):

    Domain:

    Range:

    A Cartesian coordinate system is shown with a grid. The horizontal x-axis ranges from -10 to 10, with integer markings. The vertical y-axis also ranges from -10 to 10, with integer markings. The x and y axes intersect at the origin (0, 0).

2.1.4 Homework


  1. Explain how you can determine the number of x-intercepts a quadratic function will have by knowing its a value and vertex.

Graph and identify the following characteristics for each function.

  1. [latex]f\left(x\right)=x^2+10x+26[/latex]

    Opens: Up/ Down

    Axis of symmetry:

    Vertex:

    y-intercept:

    Number of x-intercept(s):

    Domain:

    Range:

    A Cartesian coordinate system is shown with a grid. The horizontal x-axis ranges from -10 to 10, with integer markings. The vertical y-axis also ranges from -10 to 10, with integer markings. The x and y axes intersect at the origin (0, 0).
  2. [latex]f\left(x\right)=-2x^2+8x[/latex]

    Opens: Up/ Down

    Axis of symmetry:

    Vertex:

    y-intercept:

    Number of x-intercept(s):

    Domain:

    Range:

    A Cartesian coordinate system is shown with a grid. The horizontal x-axis ranges from -10 to 10, with integer markings. The vertical y-axis also ranges from -10 to 10, with integer markings. The x and y axes intersect at the origin (0, 0).

Explain how to find the other x-intercept using the y-intercept you found.

  1. [latex]f\left(x\right)=-x^2-8x-16[/latex]

    Opens: Up/ Down

    Axis of symmetry:

    Vertex:

    y-intercept:

    Number of x-intercept(s):

    Domain:

    Range:

    A Cartesian coordinate system is shown with a grid. The horizontal x-axis ranges from -10 to 10, with integer markings. The vertical y-axis also ranges from -10 to 10, with integer markings. The x and y axes intersect at the origin (0, 0).

  2. [latex]g\left(x\right)=-x^2+2x-3[/latex]

    Opens: Up/ Down

    Axis of symmetry:

    Vertex:

    y-intercept:

    Number of x-intercept(s):

    Domain:

    Range:

    A Cartesian coordinate system is shown with a grid. The horizontal x-axis ranges from -10 to 10, with integer markings. The vertical y-axis also ranges from -10 to 10, with integer markings. The x and y axes intersect at the origin (0, 0).

  3. [latex]n\left(x\right)=2x^2-16x+30[/latex]

    Opens: Up/ Down

    Axis of symmetry:

    Vertex:

    y-intercept:

    Number of x-intercept(s):

    Domain:

    Range:

    A Cartesian coordinate system is shown with a grid. The horizontal x-axis ranges from -10 to 10, with integer markings. The vertical y-axis also ranges from -10 to 10, with integer markings. The x and y axes intersect at the origin (0, 0).

  4. Create a quadratic function with axis of symmetry x=3 whose graph opens down.

License

Icon for the Creative Commons Attribution-NonCommercial-ShareAlike 4.0 International License

College Algebra for Non-STEM Majors Copyright © by Northwest Vista College Mathematics Department is licensed under a Creative Commons Attribution-NonCommercial-ShareAlike 4.0 International License, except where otherwise noted.