
1.5 Linear Graphs – Slope Intercept Method
1.5.1 Prep
A. Solve the following equations for y so that each equation is in the form [latex]y=mx+b[/latex].
- [latex]2y=3x+8[/latex]
- [latex]-3y=3x-9[/latex]
- [latex]2x+3y=15[/latex]
- [latex]3x-3y=9[/latex]
- [latex]-y=2x+1[/latex]
- [latex]15y+5x=-15[/latex]
- [latex]6x-3y=18[/latex]
- [latex]\frac12x=\frac23y=4[/latex]
- [latex]\frac12x+2y=6[/latex]
- [latex]\frac{x+y}2=-3[/latex]
- [latex]\frac13x-2y=\frac23[/latex]
- [latex]\frac12x+=\frac34y=3[/latex]
B. Evaluate [latex]\frac{a-c}{b-d}[/latex] for the given values of a, b, c, and d.
- [latex]a=10,\;b=7;\;c=4,\;d=5[/latex]
- [latex]a=5,\;b=-7;\;c=-3,\;d=9[/latex]
- [latex]a=\frac12,\;b=\frac13;\;c=\frac52,\;d-\frac56[/latex]
- [latex]a=-\frac57,\;b=2;\;c=\frac23,\;d=\frac23[/latex]
- [latex]a=8,\;b=3;\;c=8,\;d=-2[/latex]
- [latex]a=-7,\;b=4;\;c=-1,\;d=4[/latex]
- When is having 0 in a fraction defined? When is it undefined? Discuss.
1.5.2 Preview
Slope-Intercept Form
When a linear equation in two variables is written in slope-intercept form
[latex]y = mx + b[/latex]
m is the slope of the line and (0, b) is the y-intercept of the line.
Example
To find the slope and y-intercept of a line, solve for y as shown in the following example.
[latex]3x+5y=10[/latex]
[latex]5y=-3x+10[/latex]
[latex]\frac{5y}5=\frac{-3x}5+\frac{10}5[/latex]
[latex]y=-\frac35x+2[/latex]
The slope is [latex]-\frac35[/latex] and the y-intercept is (0, 2).
Try It!
For the example above, write the reason for each step out to the side.
Try It!
Find the slope and y-intercept for [latex]-4x-3y=21[/latex].
The slope of a line is [latex]m=\frac{{\text{rise}}}{{\text{run}}}=\frac{{\text{change}}\;in\;y}{{\text{change}}\;in\;x}.[/latex]
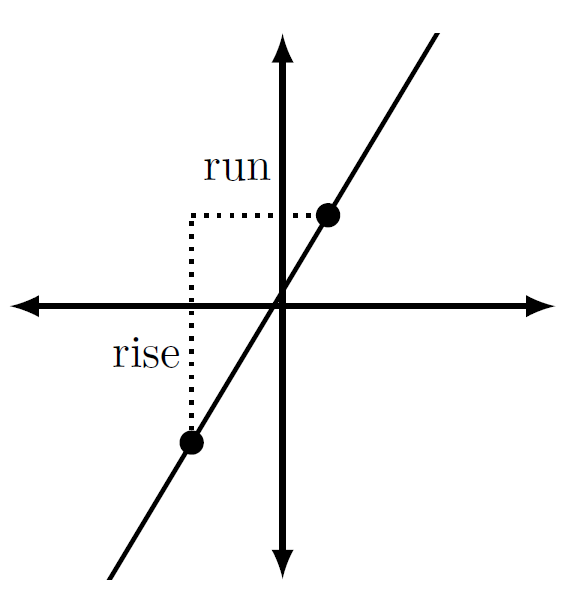
Try It!
Create possible values the rise and run show in the graph above label them on the graph.
Slope Formula
The slope m of the line containing the points (x1, y1) and (x2, y2) is given by
[latex]m=\frac{{\text{rise}}}{{\text{run}}}=\frac{{\text{change in y}}}{{\text{change in x}}}=\frac{y_2-y_1}{x_2-x_1}[/latex]
as long as [latex]x_2\neq x_1[/latex].
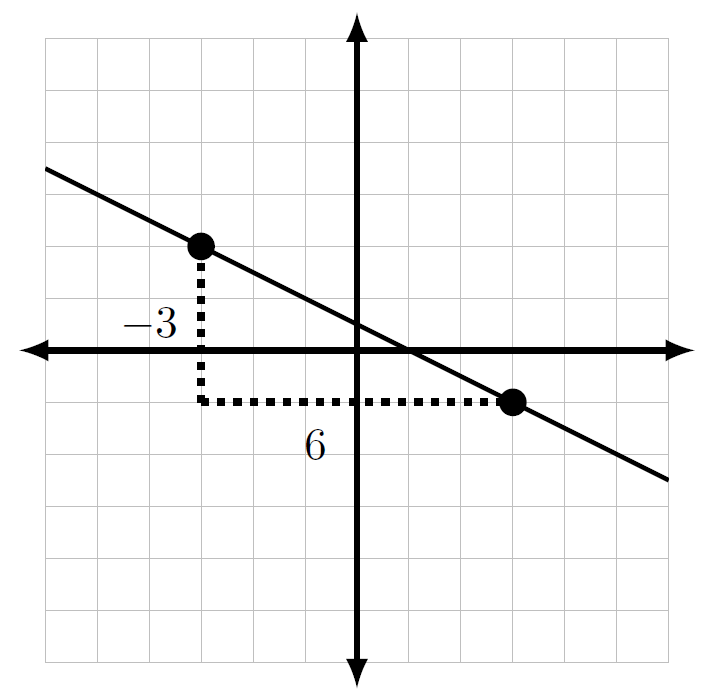
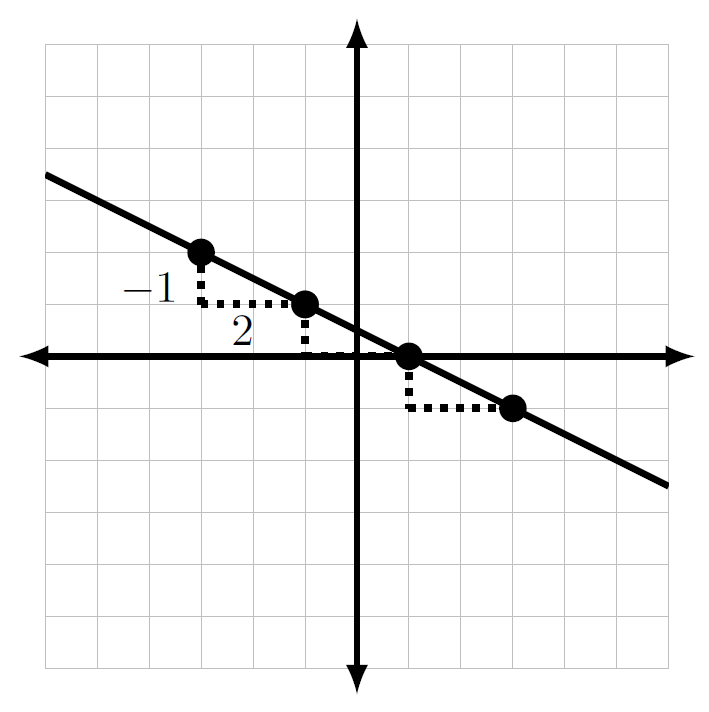
Example
The slope of the following line is [latex]m=\frac{{\text{down 3}}}{{\text{right 6}}}=\frac{-3}6=\frac{-1}2=\frac{{\text{down 1}}}{{\text{right 2}}}.[/latex]
Try It!
- Draw two lines that are parallel.
- Draw two lines that are perpendicular.
Two nonvertical lines are parallel if they have the same slope but different y-intercepts.
Two nonvertical lines are perpendicular if the slope of one is the negative reciprocal of the slope of the other.
1.5.3 Classwork
A. Write the Slope-Intercept Form and identify the slope and y-intercept for each line below.
- [latex]2y=3x+8[/latex]
- [latex]-3y=3x-9[/latex]
- [latex]2x+3y=15[/latex]
- [latex]6x-3y=9[/latex]
- [latex]-3y=12[/latex]
- [latex]\frac12x=8[/latex]
- [latex]\frac13x-2y=\frac23[/latex]
- [latex]\frac12x-\frac23y=4[/latex]
- Write an equation for a line with slope [latex]\frac34[/latex]
- Write an equation for a line with y-intercept [latex](0,-50)[/latex]
B. Use the Slope-Intercept Method to graph the following lines.
- [latex]2x+3y=15[/latex]
- [latex]-5x+y=1[/latex]
- [latex]\frac58x-\frac14y=\frac12[/latex]
- [latex]\frac14x+\frac12y=-\frac23[/latex]
- Write this line in Slope-Intercept Form:[latex]-4x+y=0[/latex]. Find both the x- and y-intercepts. What can you do to find another point on the graph of the line?
-
- Plot the points [latex](6,-2)\;\text{and}\;(8,-3)[/latex], then draw the line that passes through them.
- Find the slope of this line by counting the rise over run between these two points.
C. Find the slope of the line through the two points.
- [latex](6,-2)[/latex] and [latex](8,−3)[/latex]
- [latex]\left(\frac23,\frac56\right)[/latex] and [latex]\left(\frac53,-\frac76\right)[/latex]
- [latex](5,−3)[/latex] and [latex]\left(-2,-\frac38\right)[/latex]
- [latex]\left(1,\frac45\right)[/latex] and [latex]\left(\frac12,-\frac47\right)[/latex]
- [latex](5,−3)[/latex] and [latex](1,−3)[/latex]
- [latex](1, 4)[/latex] and [latex](1,−7)[/latex]
Parallel and Perpendicular Lines
- Use the following equations to answer the following.
Line 1: [latex]y=-\frac25x+5[/latex]
Line 2: [latex]2x+5y=15[/latex]- Find the slope of Line 1.
- Find the slope of Line 2.
- What do you notice about their slopes, and what does it mean about their graphs?
- Use the following equations to answer the following.
Line A: [latex]x-3y=1[/latex]
Line B: [latex]y-3x+4=1-6x[/latex]- Find the slope of Line A.
- Find the slope of Line B.
- What do you notice about their slopes, and what does it mean about their graphs?
1.5.4 Homework
A. Write the Slope-Intercept Form and identify the slope and y-intercept for each line below.
- [latex]\frac25x+\frac56y=10[/latex]
- [latex]x-3y=9[/latex]
- [latex]2x+2y=8[/latex]
- [latex]\frac14x-y=\frac23[/latex]
- [latex]\frac12x-\frac23y=5[/latex]
- [latex]\frac23y=-2[/latex]
B. Answer the following.
- Sketch the graphs of three different lines whose slopes are positive, negative, and zero.
- Is it possible for a line to have two different slopes? Why or why not?
C. Use the Slope-Intercept Method to graph the following lines.
- [latex]y=-\frac32x-5[/latex]
- [latex]3y=-x+9[/latex]
- [latex]-4y+x=12[/latex]
- [latex]\frac14y-\frac12x=\frac34[/latex]
- [latex]-6y=12[/latex]
- [latex]\frac12x-\frac23y=\frac52[/latex]
D. Find the slope of the line through the indicated points.
- Find the slope of the line through the points [latex](-1,4)[/latex] and [latex](5, 2)[/latex]
- using the slope formula.
- using the graph.
- [latex](4,3)[/latex] and [latex]\left(\frac72,\frac52\right)[/latex]
- [latex](-2,3)[/latex] and [latex](7,-8)[/latex]
- [latex](5,-3)[/latex] and [latex]\left(-2,\frac35\right)[/latex]
- [latex]\left(\frac56,-\frac35\right)[/latex] and [latex]\left(-2,\frac34\right)[/latex]
E. Solve the following.
- Which of the following pairs of lines are parallel or perpendicular?
- [latex]y=-\frac16x+11[/latex]
- [latex]y=6x-\frac12[/latex]
- [latex]x+6y=30[/latex]
- [latex]2x-12y=15[/latex]
