
1.6 Function Notation and Linear Applications
1.6.1 Prep
A. Evaluate the expressions.
- [latex]8x-6\text{ if }x=0[/latex]
- [latex]-t+10\text{ if }t=-4[/latex]
- [latex]3x-\frac45\text{ if }x=\frac12[/latex]
- [latex]-\frac34x+\frac18\text{ if }x=\frac54[/latex]
- [latex]2x^2+5x-20\text{ if }x=-3[/latex]
- [latex]-t^2+40t+54\text{ if }t=2.5[/latex]
B. Solve the equations.
- [latex]8x-6=0[/latex]
- [latex]-t+10=-4[/latex]
- [latex]3x-\frac45=\frac12[/latex]
- [latex]-\frac34x+\frac18=\frac54[/latex]
C. Identify the independent quantity, the dependent quantity, and the rate (if given).
- Mr. Thompson is on a diet. He currently weighs 260 pounds. He loses 4 pounds per month.
- Kara sells cars and receives a sales commission increase to her base salary for every car she sells.
- The tuition at college XYZ is $80 per credit hour with an additional $55 student fee.
- Joe has a part-time job caring for and walking dogs. He estimates that his annual insurance, etc., is $420 and on average, he spends $4.50 on gasoline per visit.
- When you climb a mountain, the higher you climb, the colder the temperature becomes.
- In 1990, Americans ate out (that is, ate meals at restaurants) an average of 143 times. By the year 2000, this had reached 170 meals out.
1.6.2 Preview
Example
The following example illustrates a function in three different ways: a table, a graph, and a rule.
Table
| x (input) | y (output) |
|---|---|
| [latex]-2[/latex] | [latex]-4[/latex] |
| [latex]-1[/latex] | [latex]-2[/latex] |
| 0 | 0 |
| 1 | 1 |
| 2 | 2 |
| 3 | 3 |
Graph
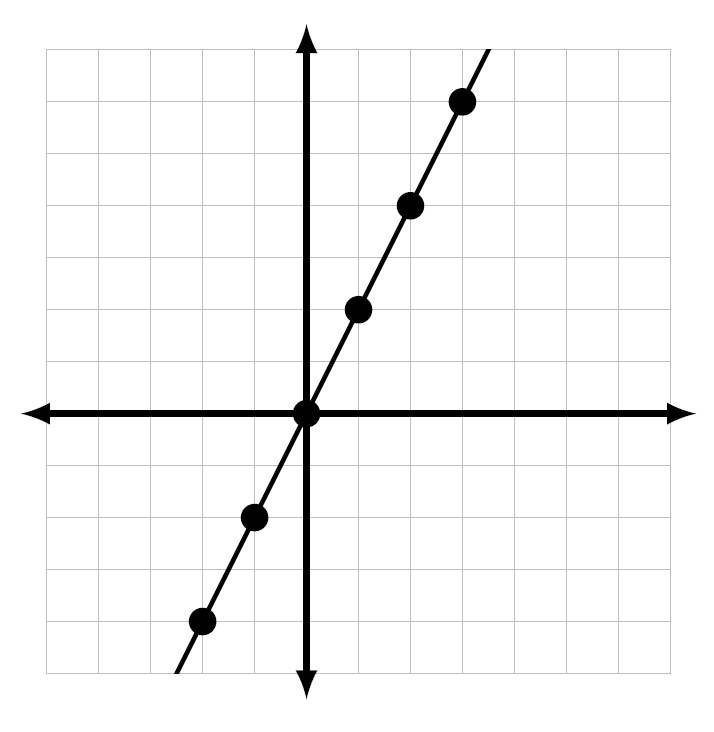
Rule
“The output is double the value of the input.”
In Algebra, functions are most often represented using equations involving variables. For example, the function given above is also represented by the equation
Notice that this equation defines a relationship between a given input, x, and an output, y, where each input goes to exactly one output.
We often use the letter f to name a function. The symbol f(x) means function of x and is read “f of x.” This notation is called function notation.
The example above may be expressed using function notation as
Then the notation f(3) means the input x is 3. To find the resulting output y, substitute 3 for x in the function equation.
Notice there is a point on the graph above where (x, y) = (3, 6).
Example
The doubling function given on the previous page
could represent the cost (in dollars) of filling up your car with gas (in gallons) if the gas costs $2 per gallon.
| x (input) | y (output) |
|---|---|
| 0 gal | $0 |
| 1 gal | $2 |
| 2 gal | $4 |
| 3 gal | $6 |
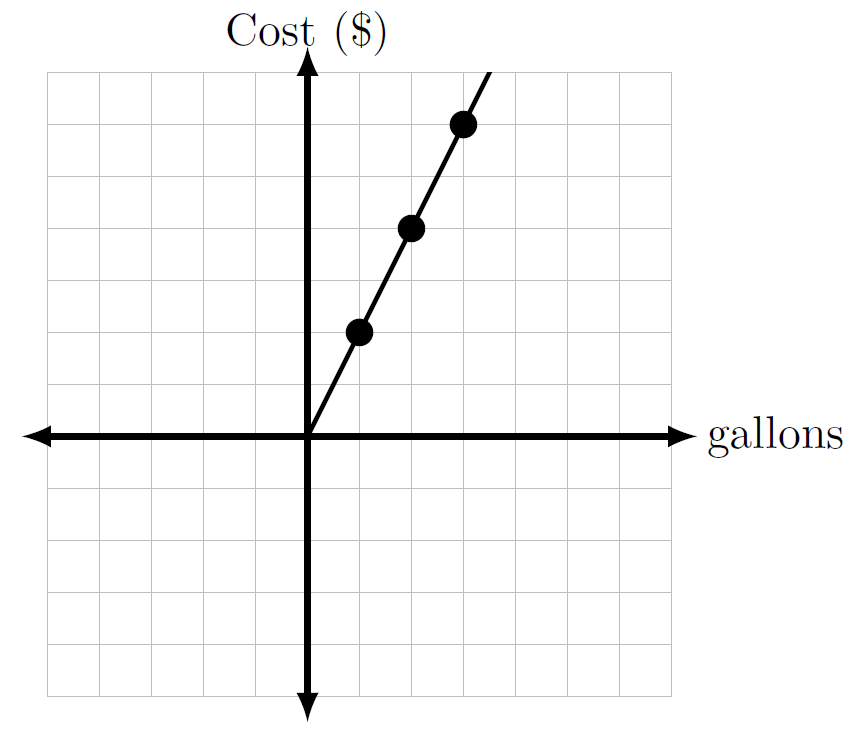
(Notice that negative values of x are excluded here because negative gallons of gas are not possible.)
Example
Suppose you bought a car for $3,500, and you pay $50 per month for insurance.
Variable cost
$50 per month
Fixed cost
$3,500
You can write a function that models this problem using the Slope-Intercept form of a linear equation. The variable cost represents the slope and the fixed cost gives the y-intercept.
[latex]y=mx+b[/latex]
[latex]f(x) = 50x + 3,500[/latex]
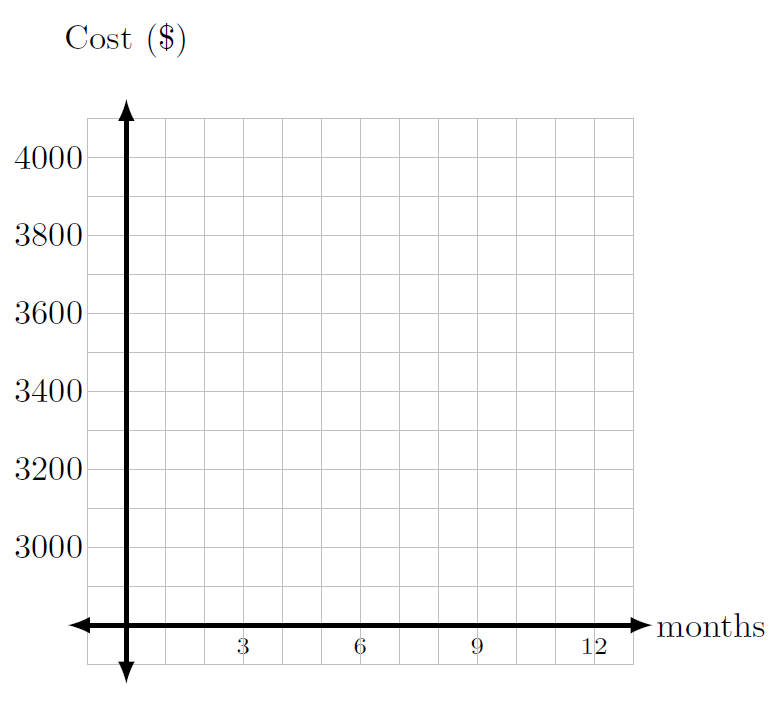
Try It!
Fill in the table below for [latex]f(x)=50x+3,\;500[/latex] and sketch its graph.
| x (months) | y (dollars) |
|---|---|
| 0 | |
| 3 | |
| 6 | |
| 9 | |
| 12 |
1.6.3 Classwork
A. Use [latex]f(x)=9x-5[/latex] to answer the following. For each question, state whether you are given the input or the output.
- Evaluate [latex]f(-3)[/latex]. What is the corresponding point on the graph?
- Evaluate f(0). What is the corresponding point on the graph?
- Find x, given f(x) = 85. What is the corresponding point on the graph?
- Evaluate f(a).
- Evaluate [latex]f\left(\frac23\right)[/latex]. What is the corresponding point on the graph?
- Find the value of x when f(x) = 0. What is the corresponding point on the graph?
Use the following graph to answer the questions.
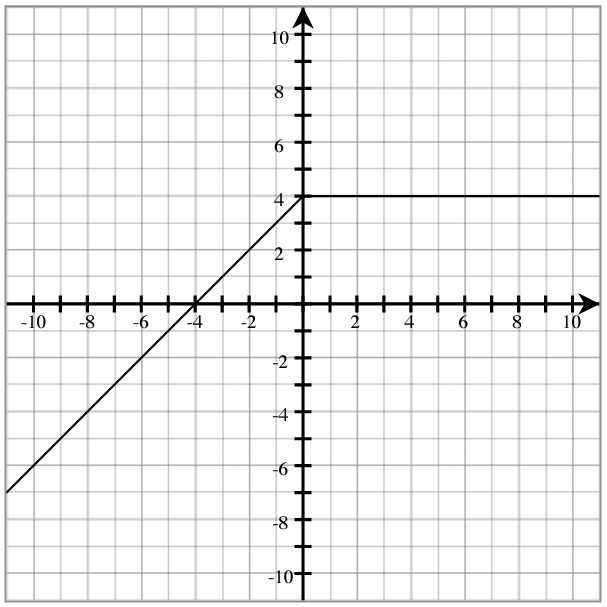
- [latex]f(3)=[/latex]
- [latex]f(-3)=[/latex]
- [latex]f(0)=[/latex]
- [latex]f(-4)=[/latex]
- [latex]f(-10)=[/latex]
- For what value of x is [latex]f(x)=3?[/latex]
- For what value of x is [latex]f(x)=1?[/latex]
- For what value of x is [latex]f(x)=0?[/latex]
C. Solve the following application problems.
- If one gallon of gas costs $2.50, how much will it cost to fill a 15 gallon tank? Solve using
- a proportion
- a conversion (gallons to dollars)
- a linear function
- Explain in your own words why they all give the same answer.
- Look up the cost per credit hour at NVC and UTSA to answer the following.
- How much would it cost just to take 12 credit hours at each school?
- What other costs does this fail to take into account? Discuss.
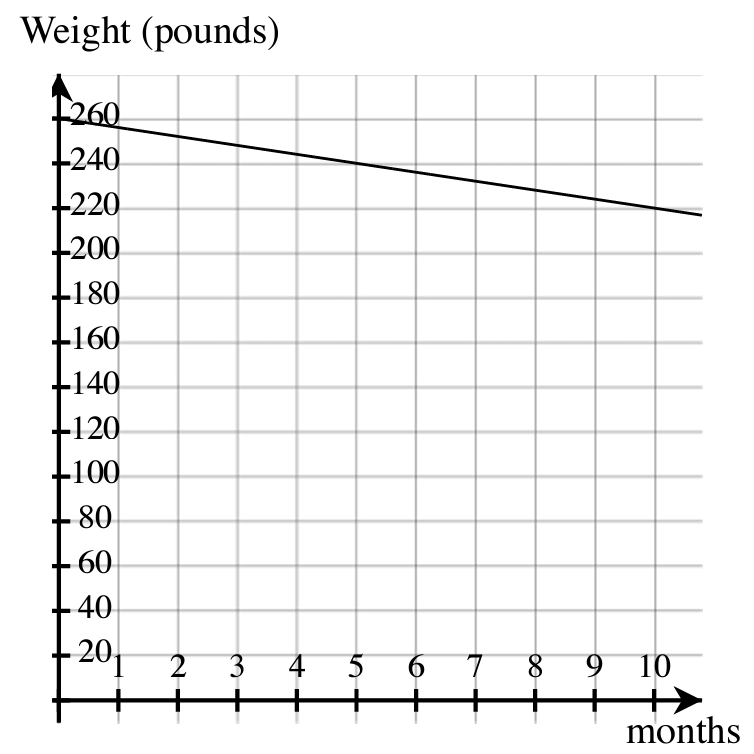
- Mr. Thompson is on a diet. The graph below shows his weight over time.
- How much did he weigh when he started the diet?
- How much weight did he lose every month?
- Estimate how long he has to be on the diet to weigh 198 pounds.
- Kara uses the linear model f(x) = 20, 000 + 0.3x to predict her total salary from achieving total sales of x. Interpret the slope and y-intercept in terms of her salary and sales.
- Joe has a part time job caring for and walking dogs. He estimates that his annual insurance, etc. is $420. On average, he spends $4.50 on gasoline per visit. He charges $15 per visit. Note that this is an annual cost function.
- Explain how to find his total cost.
- Fill in the table for the values below
- Suppose his budget is $1,000, how many visits could he make annually?
Visits Cost (dollars) 0 1 2 3 4 x
- In meteorology, the temperature is related to the altitude by the formula [latex]T(h)=-3.5h+58.6[/latex] where h is in thousands of feet and T is the temperature in degrees Fahrenheit.
- Identify and interpret the slope.
- What should be the temperature if the height is 12,000 feet?
- At what height will the temperature be 32 degrees F?
- In 1990, Americans ate out (that is, ate meals at restaurants) an average of 143 times. By the year 2000, this had reached 170 meals out a year. If there is constant growth, how many meals a year do you expect us to eat out in 2030?
- Give an example of a real-life situation with a variable cost and a fixed cost.
- A bacteria population doubles every minute. Explain why this population growth cannot be modeled using a linear equation.
- How much water should be added to 1 quart of 3% milk to result in a 2% solution? How many quarts of 2% solution would this make?
1.6.4 Homework
A. Use [latex]f(x)=4x+7[/latex] to answer the following. For each question, state whether you are given the input or the output.
- Evaluate [latex]f(-3)[/latex]. What is the corresponding point on the graph?
- Find x, given [latex]f(4)[/latex]. What is the corresponding point on the graph?
- Evaluate [latex]f(x)=33[/latex]. What is the corresponding point on the graph?
- Evaluate f(6). What is the corresponding point on the graph?
- Find x if [latex]f\left(\frac18\right)[/latex]. What is the corresponding point on the graph?
- Find x if f(x) = 0. What is the corresponding point on the graph?
- Explain in your own words the difference between the notations f(x) and f(5).
- A student was given [latex]f(x)=10x-7[/latex] and asked to find where f(x) = 0. Explain their errors below.
[latex]f(0)=10(0)-7[/latex]
[latex]f(0)=-7[/latex]
Use the following graph to answer the questions.
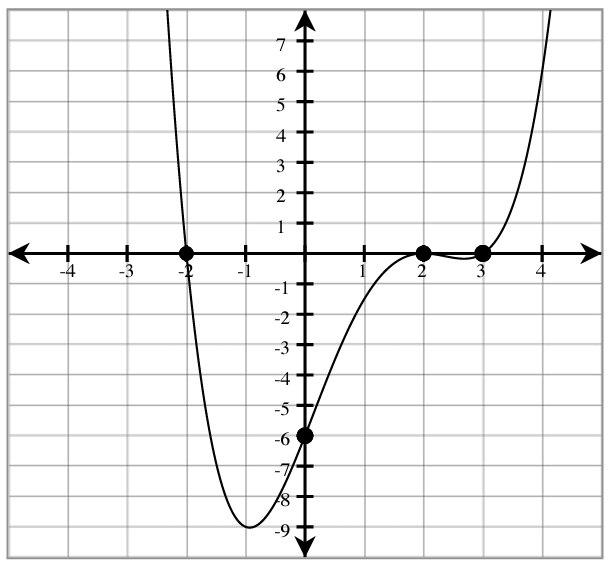
- [latex]f(-2)=[/latex]
- [latex]f(1)=[/latex]
- [latex]f(4)=[/latex]
- [latex]f(0)=[/latex]
- Estimate where [latex]f(x)=w-3[/latex].
- Estimate where [latex]f(x)=1[/latex].
- Estimate where [latex]f(x)=-9[/latex].
- Estimate where [latex]f(x)=0[/latex].
B. Solve the following application problems.
- Joe’s heart beats 11 times in 10 seconds. At that rate, how many times does his heart beat in 60 seconds. Solve using
- a proportion
- a linear function
- a conversion (seconds to beats)
- Explain in your own words why they all give the same answer.
- Find the current minimum wage in Seattle and San Antonio to answer the following.
- How much would you get paid for working 40 hours in each city at these rates?
- What other compensations does this fail to take into account? Discuss.
- George leases a machine for his business. He pays an initial fee of $1,000 and then a maintenance cost of $115 a month.
- Write a function C(x) that calculates the cost of leasing the machine for x months.
- How much has he paid at the end of one year?
- The linear function C(t) = 5.99t + 99 models the cost C (in dollars) of renting a DVR for t months.
- Find and interpret the y-intercept.
- Find and interpret the slope.
- How much will it cost to rent this DVR for two years?
- The charges for traveling on a certain toll road are computed by starting with a base charge of one dollar and then charging 5 cents per mile.
- Explain how you would find the total cost.
- Fill in the table below for the given values.
- If Claudia was charged $2.45, how far did she drive on that toll road?
Miles Cost (dollars) 0 5 10 20 30 x
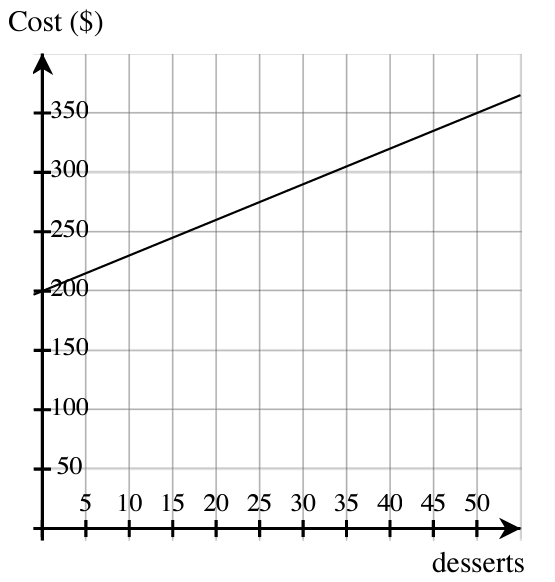
- The graph below shows the daily costs a dessert shop has based on the number of desserts they sell.
- What are their daily fixed costs?
- How much does it cost them to produce each dessert?
- Estimate how many desserts they can make for $800. Then find the answer by writing an equation for this function.
- In 2010, U.S. households held an average of $7,768 in credit card debt. In 2015, this number was $7,327. Assuming that this change is linear:
- Find and interpret the slope.
- Write a function D(x) modeling debt D in terms of x years (starting in 2010).
- Predict average credit card debt in 2035.
- Seven gallons of 4% acid is mixed with some 1% acid to produce a 2% acid solution. How much 1% acid is required, and how many gallons of 2% solution would this make?
