
1.7 Concept Review
Concept Review: Percent, Proportion, Conversions, Lines
-
- Explain in your own words the relationship between Ratio, Decimal, and Percent.
- Give an equivalent example of each. (Note: You may find it more helpful to answer part (b) before part (a).)
- Which of the following ratio(s) can be written as a percent? (And if so, what is the percent?)
- Traveling 55 miles per hour
- 21 students pass a math test out of a class of 24 students
- 195 calories in a donut
- Earning 2 hours and 24 minutes towards your Exam 1 lab requirement (200 minutes)
- Find all the errors and explain how to fix them.Luis left a $5 tip on a $22.70 check. Then the percent tip he left is[latex]\frac{22.70}5=4.54\%[/latex]
-
- What is a proportion? How can you recognize when a problem can be set up as a proportion?
- Make up a proportion problem.
-
- [latex]\ln\;2018[/latex], only [latex]551,073[/latex] people voted out of the [latex]1,073,320[/latex] registered voters in Bexar County. If [latex]1,300,000[/latex] people are registered in Bexar County, predict how many of them will vote.
- Solve this problem using a second method.
- Name three units that are part of the metric system. Name three units that are not metric (Imperial).
- Describe two ways you can perform conversions within the metric system and give an example using each.
- Explain the differences between converting [latex]100[/latex] ft to cm versus converting [latex]100\;\mathrm{ft}^2\;\text{to}\;\mathrm{cm}^2.[/latex]
-
- What are two different methods for graphing a line?
- How are these methods similar or different?
- Which method do you prefer, and why?
- The equation [latex]4x+2y=8[/latex] is equivalent to the equation [latex]y=-2x+4.[/latex]
- What information can you obtain from each equation to draw its graph?
- Sketch the graph.
-
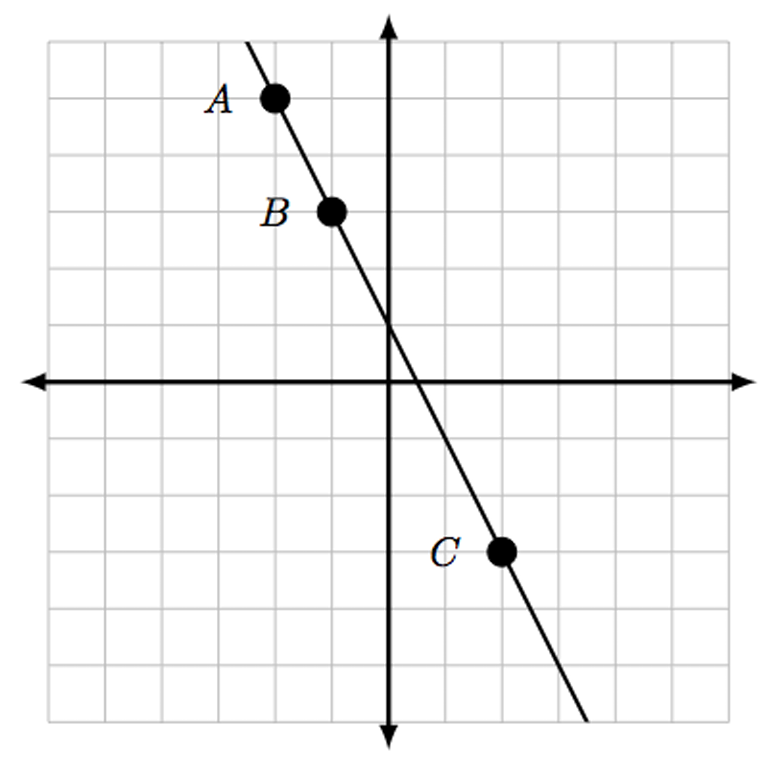
- Find the slope of the line by counting the rise over run between points [latex]A[/latex] and [latex]B[/latex] on the graph.
- Find the slope of the line using the [latex](x,y)[/latex] coordinates of points [latex]A[/latex] and [latex]C[/latex] and the slope formula.
- Why are your answers in (a) and (b) the same?
- Let [latex]f\left(x\right)=-5x=20[/latex]. Describe the difference between [latex]f\left(0\right)[/latex] and where [latex]f\left(x\right)=0[/latex]
