
2.1 Graphing Quadratic Functions
2.1.1 Prep
Prep for Graphing Quadratic Functions
Match each mathematical notation to a correct definition.
-
_____________ (0,1)
_____________ 1
_____________ x=1
_____________ x=1
_____________ (1,0)
_____________ y=1
- A point that is one to the right of the origin
- A point that is one above the origin
- A vertical line
- A possible solution to an equation with variable 𝑥
- A horizontal line
- The first natural number
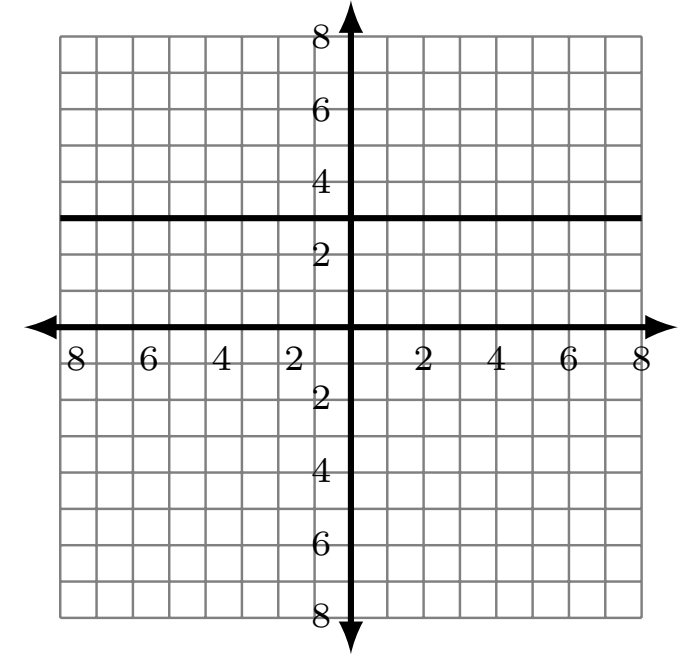
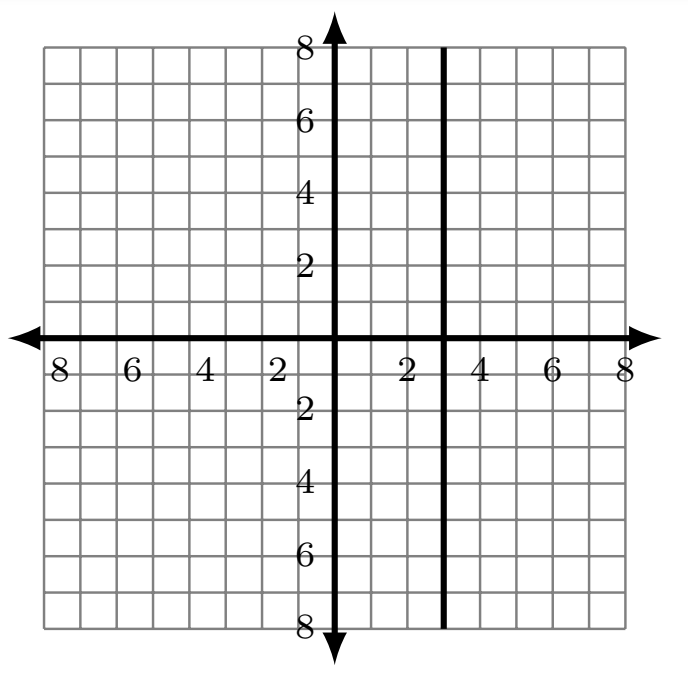
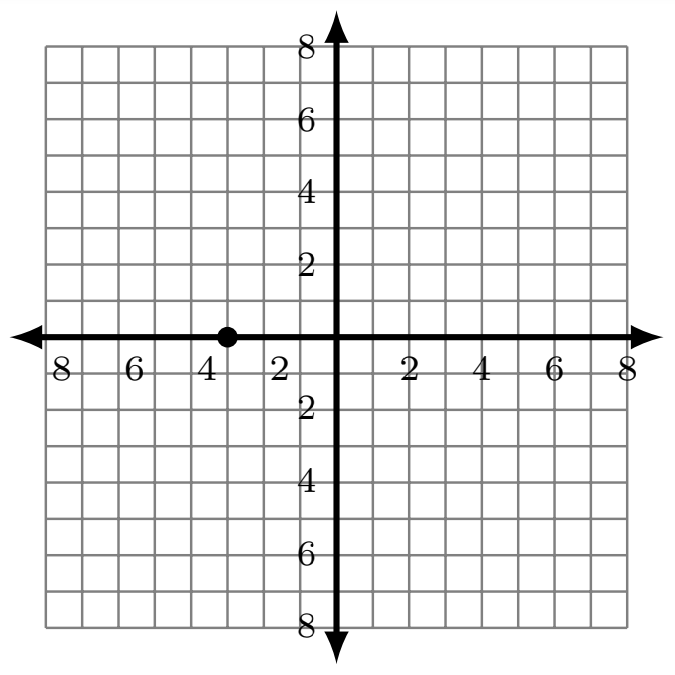
Use the correct notation to define each line or point.
The Vertex Formula
The following expression will be used to help find the vertex of a quadratic function: [latex]-\frac b{2a}[/latex]
Example
Let a=3 and b=6
This formula involves division, and multiplication, and grouping. The fraction bar that separates the numerator from the denominator “groups” the denominator together, so the denominator should be evaluated first.
Evaluate the expression.
- Spot the error!
Two students attempted to evaluate [latex]-\frac8{2\left(4\right)}[/latex] using calculators.
These were their results.
Student A : [latex]-8/2\ast4=-16[/latex]
Student B : [latex]-8/\left(2\ast4\right)=-1[/latex]
Which student is incorrect and what caused their error?
Try It!
Evaluate [latex]-\frac b{2a}[/latex] for each of the following values of a and b.
- [latex]a=1,b=8[/latex]
- [latex]a=-3,b=-9[/latex]
- [latex]a=-2, b=16[/latex]
- For the function [latex]f\left(x\right)=-\frac5{2x}[/latex] find
- [latex]f\left(3\right)[/latex]
- [latex]f\left(-5\right)[/latex]
- [latex]f\left(\frac14\right)[/latex]
Example
Find f(2) for the function [latex]f\left(x\right)=3x^2-4x+7[/latex]
It is important to recall that exponents are evaluated before multiplication when correctly applying the order of operations.
Also note that addition and subtraction occur at the same time within the order of operations, worked from left to right. So the subtraction [latex]\left(12-8\right)[/latex] takes place before the addition [latex](4+7)[/latex] here.
- For the function [latex]g(x)=4x^2+5x+6[/latex] find
- [latex]g(3)[/latex]
- [latex]g(-1)[/latex]
- [latex]g\left(\frac12\right)[/latex]
- For the function [latex]h(x)=-x^2-7x-8[/latex] find
- [latex]h(2)[/latex]
- [latex]h(-1)[/latex]
- [latex]h(-4)[/latex]
- For the function [latex]f\left(x\right)=-x^2+4x-8[/latex] find
- [latex]f(-1)[/latex]
- [latex]f\left(\frac34\right)[/latex]
- [latex]f\left(-\frac12\right)[/latex]
Answer the following
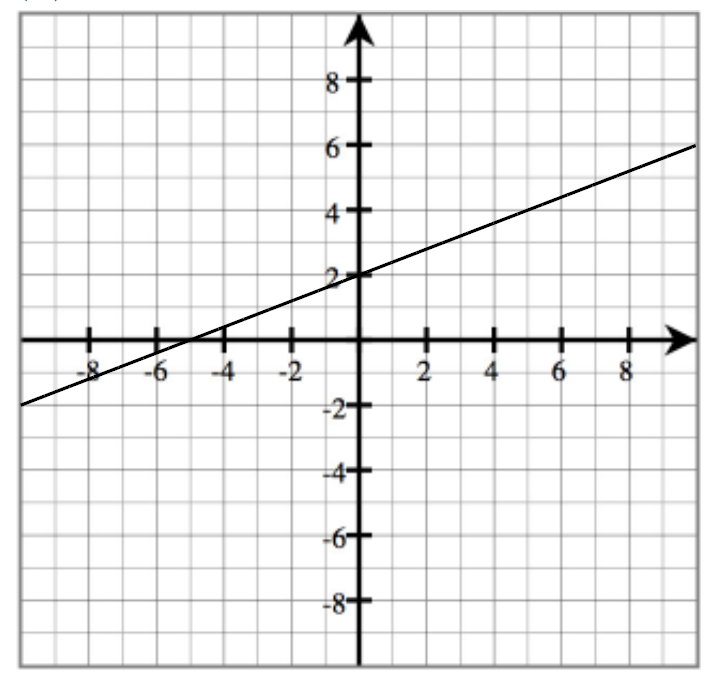
- What is an intercept?
- Find the intercepts, and write your answers using the correct notation.
y-intercept:_________________
x-intercept:_________________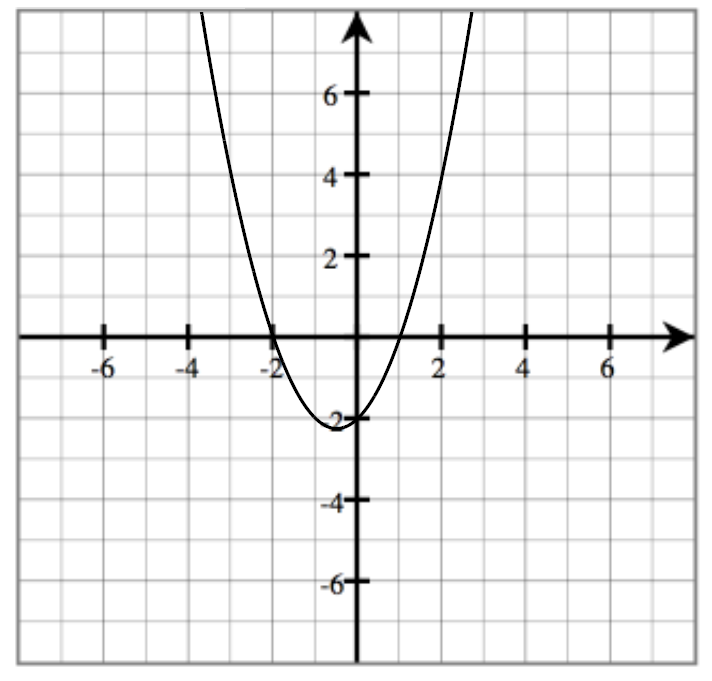
y-intercept:__________________
x-intercepts:_________________
Answer the following.
- Are the two expressions equivalent?
- [latex]\frac xy+\frac3y[/latex] and [latex]\frac{x+3}y[/latex]
- [latex]5+6\div3[/latex] and [latex]\frac{5+6}3[/latex]
Discuss the following
- What do the symbols [latex]\infty[/latex] and [latex]-\infty[/latex] mean? Where are they located on a graph? When might these symbols be used?
Plot the following points. Then connect them in order.
- [latex](-10,0)[/latex]
- [latex](-8,1)[/latex]
- [latex](-6,2)[/latex]
- [latex](-4,3)[/latex]
- [latex](0,5)[/latex]
- [latex](4,3)[/latex]
- [latex](6,2)[/latex]
- [latex](8,1)[/latex]
- [latex](10,0)[/latex]
- [latex](4,-3)[/latex]
- [latex](0,-5)[/latex]
- [latex](-4,-3)[/latex]
- [latex](-10,0)[/latex]
- [latex](-2.5,\;0)[/latex]
- [latex](-1.75,\;2)[/latex]
- [latex](1.75,\;2)[/latex]
- [latex](2\frac12,0)[/latex]
- [latex]\left(1\frac34,-2\right)[/latex]
- [latex](-1\frac34,-2)[/latex]
- [latex](-2.5,0)[/latex]
2.1.2 Preview
Try It!
Graph the function [latex]f\left(x\right)=x[/latex] by completing the table below and plotting points.
| x | y = x |
|---|---|
| -3 | |
| -2 | |
| -1 | |
| 0 | |
| 1 | |
| 2 | |
| 3 |
Try It!
Graph the function [latex]g\left(x\right)=x^2[/latex] by completing the table below and plotting points.
| x | [latex]{\color[rgb]{1.0, 1.0, 1.0}\boldsymbol y}{\color[rgb]{1.0, 1.0, 1.0}\mathbf=}{\color[rgb]{1.0, 1.0, 1.0}\boldsymbol x}^{\color[rgb]{1.0, 1.0, 1.0}\mathbf2}[/latex] |
|---|---|
| -3 | |
| -2 | |
| -1 | |
| 0 | |
| 1 | |
| 2 | |
| 3 |
Describe the differences between the shape of the graphs for f and g above
Try It!
Graph the function [latex]h\left(x\right)=x^2-4[/latex] by completing the table below and plotting points.
| x | [latex]{\color[rgb]{1.0, 1.0, 1.0}\boldsymbol y}{\color[rgb]{1.0, 1.0, 1.0}\mathbf=}{\color[rgb]{1.0, 1.0, 1.0}\boldsymbol x}^{\color[rgb]{1.0, 1.0, 1.0}\mathbf2}{\color[rgb]{1.0, 1.0, 1.0}\mathbf-}{\color[rgb]{1.0, 1.0, 1.0}\mathbf4}[/latex] |
|---|---|
| -3 | |
| -2 | |
| -1 | |
| 0 | |
| 1 | |
| 2 | |
| 3 |
Try It!
How does the graph of [latex]h\left(x\right)=x^2-4[/latex] compare to the graph of [latex]g\left(x\right)=x^2[/latex]?
2.1.3 Classwork
A quadratic function is of the form [latex]f(x)=ax^2+bx+c[/latex], where [latex]a\neq0[/latex]. The graph of a quadratic function is called a parabola.
For each parabola below, label the following: vertex, axis of symmetry, y-intercept, x-intercepts, and max (or min).
The parabola opens up if ________________. The parabola opens down if ________________.
The axis of symmetry (line of symmetry): x = ________________.
To find the y-intercept:
Sketch three different examples of a parabola that has two, one, or no x-intercepts.
Find the x-intercept(s) by solving [latex]f\left(x\right)=0[/latex]. We will learn how to solve such equations in later sections.
Domain:
Range:
Use the vertex and whether the graph opens up or down to determine the number of x-intercepts. Sketch the graph.
- [latex]f\left(x\right)=x^2+5x+4[/latex]
- [latex]f\left(x\right)=x^2-3x+10[/latex]
- [latex]f\left(x\right)=-x^2+10x-25[/latex]
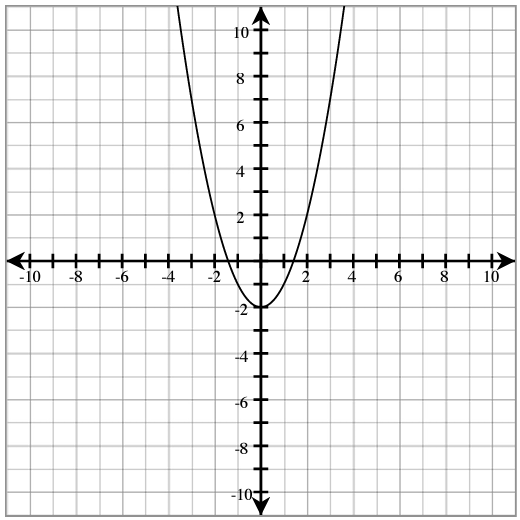
Use these graphs to answer the questions below.
- What is the axis of symmetry for Graph A?
- What is the vertex of Graph A?
- Does this vertex give a maximum or minimum?
- Identify the domain and range of Graph A.
- Identify the y-intercept of Graph A.
- Explain how (6, -5) is related to your answer for v.
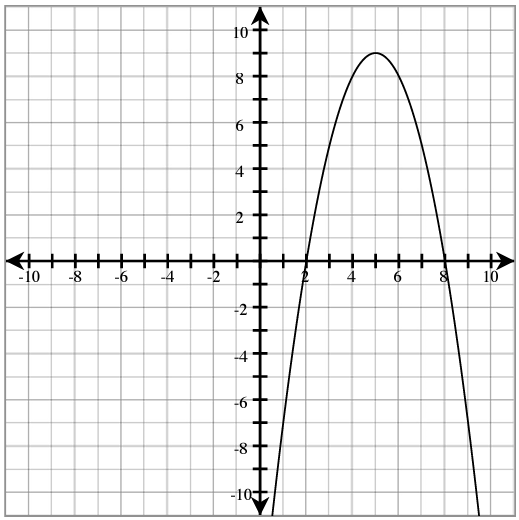
- What is the axis of symmetry for Graph B?
- What is the vertex of Graph B?
- Does this vertex give a maximum or minimum?
- Identify the domain and range of Graph B.
- Identify the y-intercept of Graph B.
- Explain how (-4, -1) is related to your answer for v.
Sketch the graph and identify the following characteristics for each function.
-
[latex]f\left(x\right)=x^2-6x+13[/latex]
Opens: Up/ Down
Axis of symmetry:
Vertex:
y-intercept:
Number of x-intercept(s):
Domain:
Range:
-
[latex]f\left(x\right)=-x^2-2x-1[/latex]
Opens: Up/ Down
Axis of symmetry:
Vertex:
y-intercept:
Number of x-intercept(s):
Domain:
Range:
Find another point to plot using the y-intercept. Find its mirror image across the axis of symmetry.
-
[latex]g\left(x\right)=-x^2+4x+3[/latex]
Opens: Up/ Down
Axis of symmetry:
Vertex:
y-intercept:
Number of x-intercept(s):
Domain:
Range:
Find another point to plot using the y-intercept. Find its mirror image across the axis of symmetry.
-
[latex]\normalsize g(x)=-3x^2-30x-82[/latex]
Opens: Up/ Down
Axis of symmetry:
Vertex:
y-intercept:
Number of x-intercept(s):
Domain:
Range:
2.1.4 Homework
- Explain how you can determine the number of x-intercepts a quadratic function will have by knowing its a value and vertex.
Graph and identify the following characteristics for each function.
-
[latex]f\left(x\right)=x^2+10x+26[/latex]
Opens: Up/ Down
Axis of symmetry:
Vertex:
y-intercept:
Number of x-intercept(s):
Domain:
Range:
-
[latex]f\left(x\right)=-2x^2+8x[/latex]
Opens: Up/ Down
Axis of symmetry:
Vertex:
y-intercept:
Number of x-intercept(s):
Domain:
Range:
Explain how to find the other x-intercept using the y-intercept you found.
-
[latex]f\left(x\right)=-x^2-8x-16[/latex]
Opens: Up/ Down
Axis of symmetry:
Vertex:
y-intercept:
Number of x-intercept(s):
Domain:
Range:
-
[latex]g\left(x\right)=-x^2+2x-3[/latex]
Opens: Up/ Down
Axis of symmetry:
Vertex:
y-intercept:
Number of x-intercept(s):
Domain:
Range:
-
[latex]n\left(x\right)=2x^2-16x+30[/latex]
Opens: Up/ Down
Axis of symmetry:
Vertex:
y-intercept:
Number of x-intercept(s):
Domain:
Range:
- Create a quadratic function with axis of symmetry x=3 whose graph opens down.
