"

3.1 Polynomial Functions and Their Graphs

3.1.1 Prep


A. Answer the following.

A parabola is graphed on a Cartesian coordinate system. The x-axis ranges from -9 to 9, and the y-axis ranges from -9 to 9, with integer markings. The parabola opens upwards, with its vertex at (0, -4). It intersects the y-axis at (0, -4) and the x-axis at (-2, 0) and (2, 0).

    1. How many x-intercepts are shown?
    2. List all x-intercepts shown.
    3. Does the graph cross or bounce off the x-axis at each x-intercept?

A graph of a polynomial function is shown on a Cartesian coordinate system. The x-axis ranges from -9 to 9, and the y-axis ranges from -9 to 9, with integer markings. The black curve intersects the x-axis at (-3,0), (-1,0) and (2,0). It also intersects y-axis at (0,6).

    1. How many x-intercepts are shown?
    2. List all x-intercepts shown.
    3. Does the graph cross or bounce off the x-axis at each x-intercept?

A parabola is graphed on a Cartesian coordinate system. The x-axis ranges from -9 to 9, and the y-axis ranges from -9 to 9, with integer markings. The parabola opens upwards, with its vertex at (-4, 0). It touches the x-axis at (-4,0) and the parabola lie in second quadrant.

    1. How many x-intercepts are shown?
    2. List all x-intercepts shown.
    3. Does the graph cross or bounce o the x-axis at each x-intercept?

A parabola is graphed on a Cartesian coordinate system. The x-axis ranges from -9 to 9, and the y-axis ranges from -9 to 9, with integer markings. The parabola opens upwards, with its vertex at approximately (-2, 1). It intersects the y-axis above the origin at the point (0,2) and does not appear to intersect the x-axis.

    1. How many x-intercepts are shown?
    2. List all x-intercepts shown.
    3. Does the graph cross or bounce o the x-axis at each x-intercept?
  1. Solve by factoring. [latex]2x^2-5x-3=0[/latex]
  2. Work backwards to write a quadratic equation in factored form with the given solutions.

    [latex]x =-2[/latex]   [latex]x = 9[/latex]

    [latex]x + 2 = 0[/latex]   [latex]x\_\_\_\_= 0[/latex]

    [latex]\left(\_\_\_\_\_\_\_\_\_\_\_\_\right)\;\;\left(\_\_\_\_\_\_\_\_\_\_\_\_\_\right)\;=0[/latex]

B. Write a quadratic equation in factored form with the given solutions.

  1. [latex]x=-3\;\text{and}\;x=8[/latex]
  2. [latex]x=0\;\text{and}\;x=5[/latex]
  3. [latex]x=4\;\text{and}\;x=-\frac7{10}[/latex]
  4. [latex]x=2\;\text{and}\;x=2[/latex]
  5. [latex]x=\frac23\;\text{and}\;x=-\frac1{2}[/latex]
  6. [latex]x=-4\;\text{and}\;x=\frac3{5}[/latex]

3.1.2 Classwork


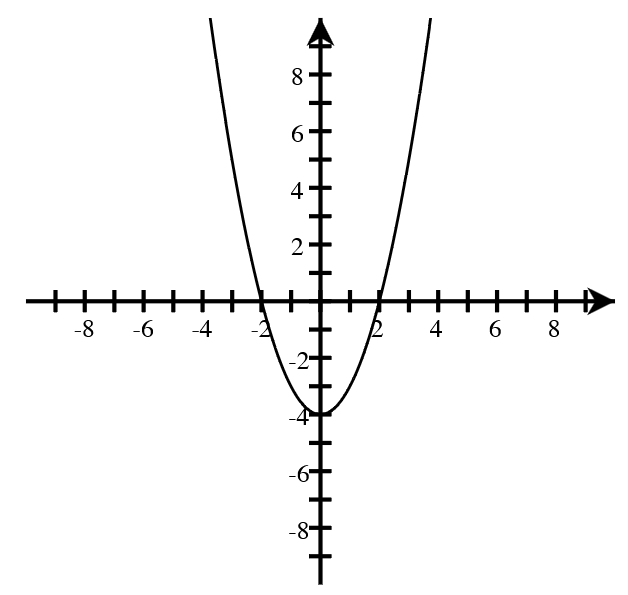
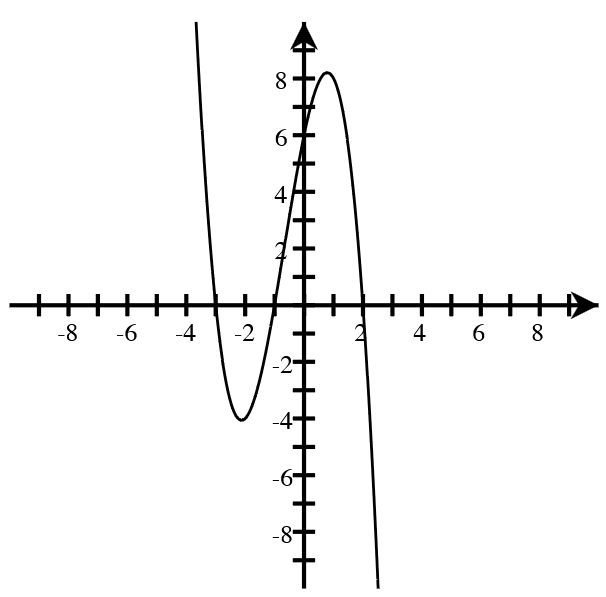
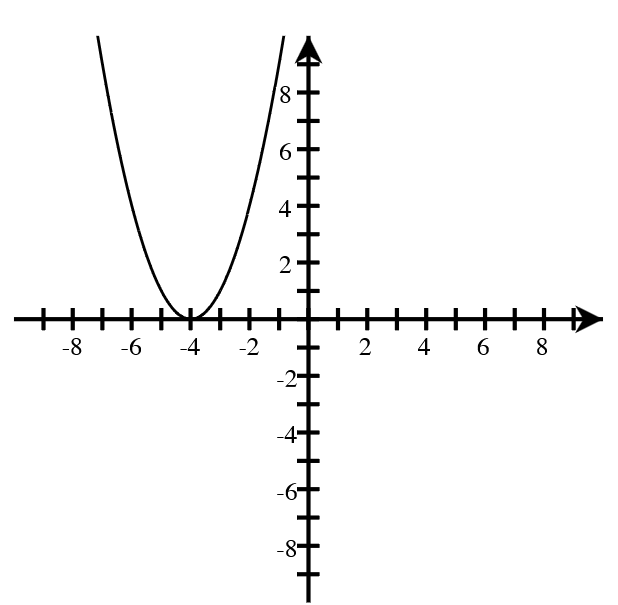
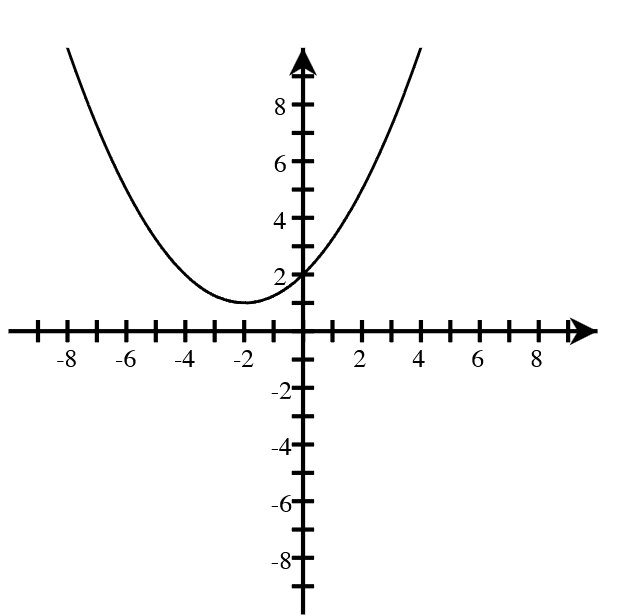
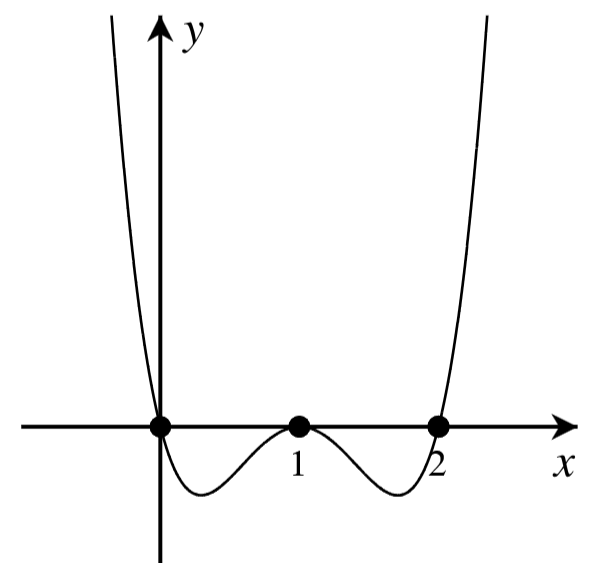
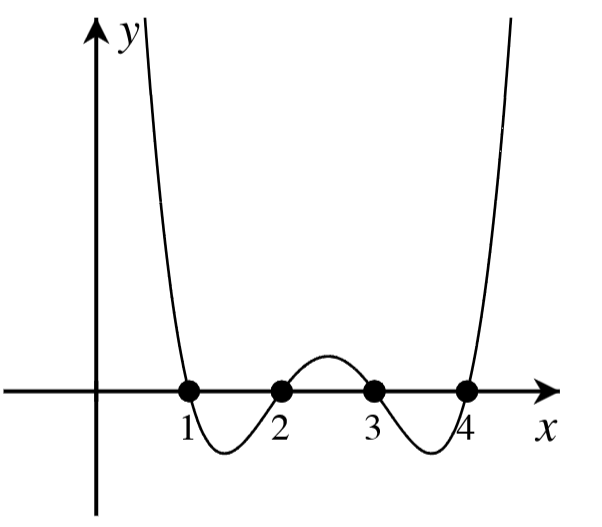
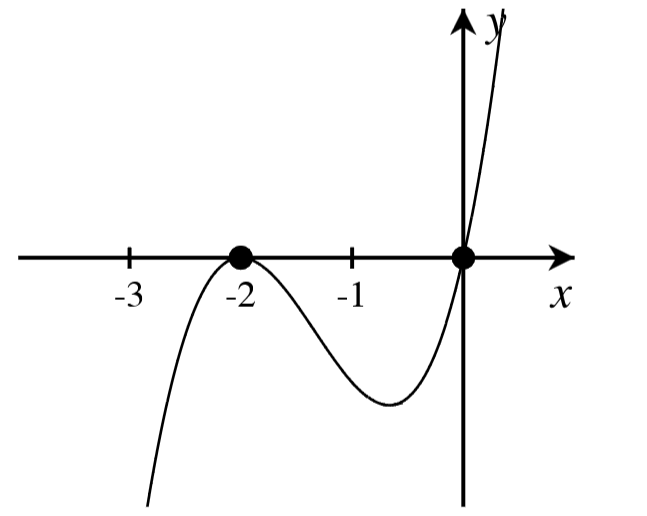
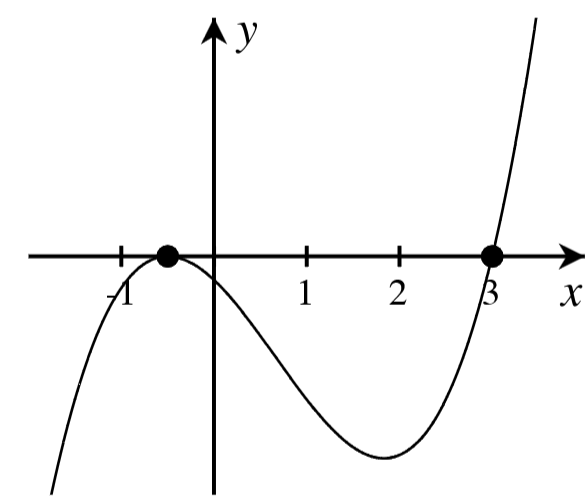
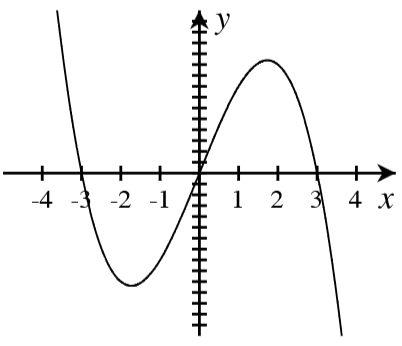
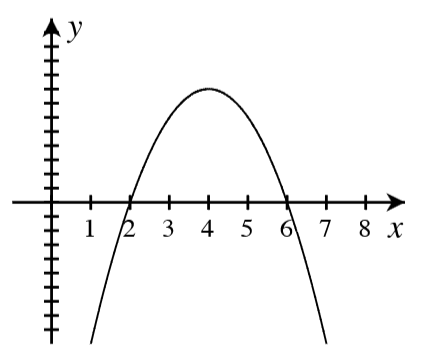
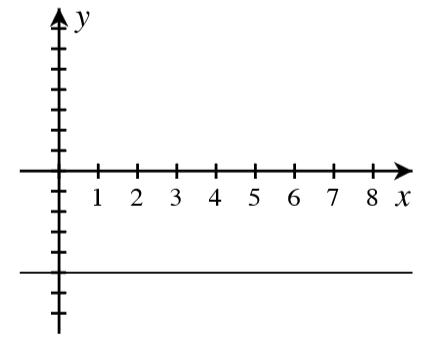
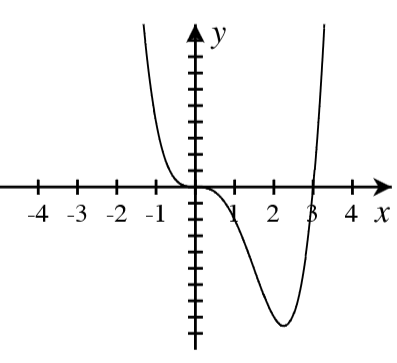
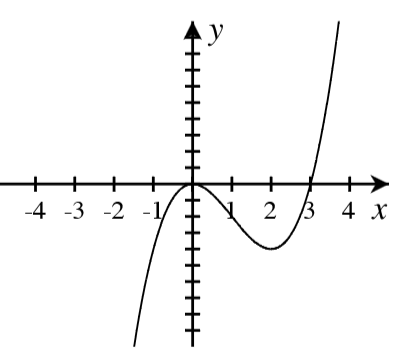
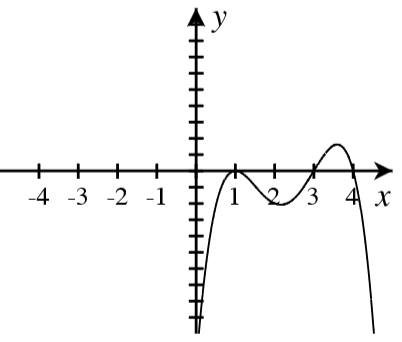
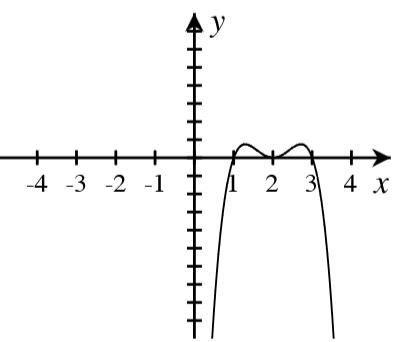
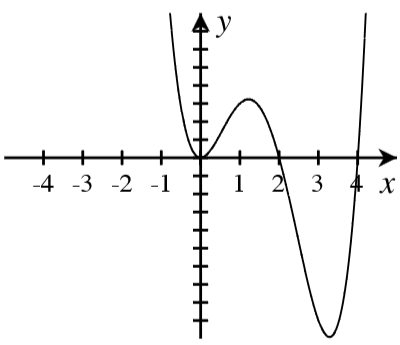
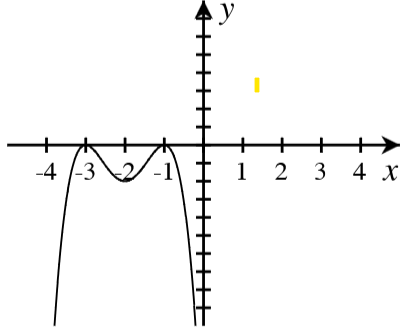
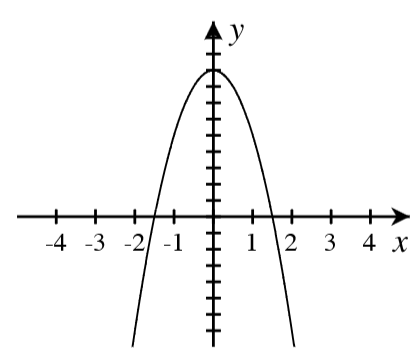
A. For each graph below, answer the following.

  1. How many real roots are shown in the graph?
  2. What is the minimum possible degree of the polynomial if it has only the real roots shown?
  3. Write a possible equation for the function in factored form with the minimum degree.
  1. A graph of a polynomial function is shown on a Cartesian coordinate system with labeled x and y axes. The x-axis is marked with the numbers 1 and 2 at specific points. The black curve of the function intersects the x-axis at three distinct points. At one of these intersection points, the curve touches the x-axis and changes direction without crossing it. At the other two intersection points, the curve crosses the x-axis.
  2. A graph of a polynomial function is shown on a Cartesian coordinate system with labeled x and y axes. The x-axis is marked with the numbers 1, 2, 3, and 4 at specific points where the black curve of the function intersects the x-axis.
  3. A graph of a polynomial function is shown on a Cartesian coordinate system with labeled x and y axes. The x-axis is marked with the numbers -3, -2, and -1. The black curve of the function intersects the x-axis at two distinct points. At origin, the curve crosses the x-axis, and at (-2,0), the curve touches the x-axis and changes direction.
  4. A graph of a polynomial function is shown on a Cartesian coordinate system with labeled x and y axes. The x-axis is marked with the numbers -1, 1, 2, and 3. The black curve of the function intersects the x-axis at two distinct points. It touches the x axis at approximately (-0.5,0) and then changes its direction after that the curve intersects x axis at (3,0).

3.1.3 Homework


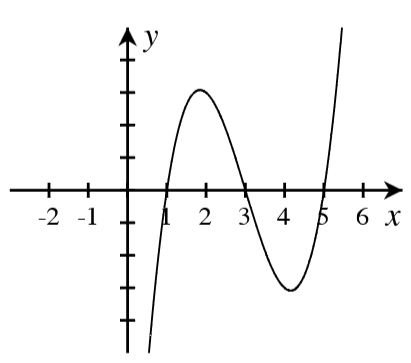
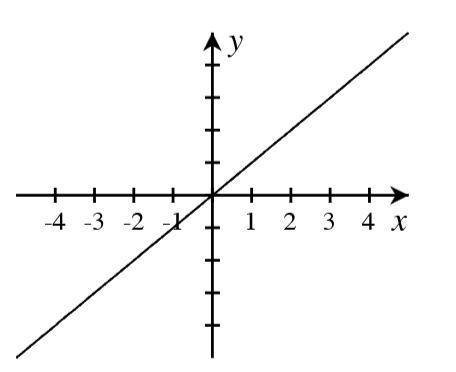
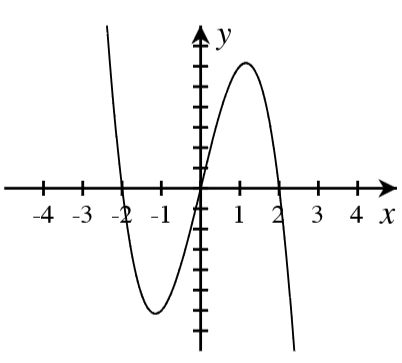
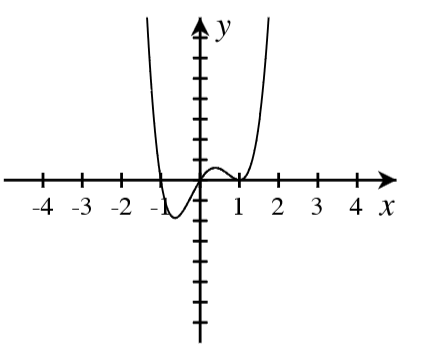
A. For each of the following, use the x-intercepts to match the equation to its graph.

  1. [latex]f(x)\;=\;x^2(x-3)[/latex]
  2. [latex]f(x)\;=-2x(x+2)(x-2)[/latex]
  3. [latex]f(x)\;=-2{(x+3)}^{2}\;{(x+1)}^2[/latex]
  4. [latex]f(x)\;=\;x[/latex]
  5. [latex]f(x)\;=\;(x-1)(x-3)(x-5)[/latex]
  6. [latex]f(x)\;=-x(x+3)(x-3)[/latex]
  7. [latex]f(x)\;=\;x^2(x-2)(x-4)[/latex]
  8. [latex]f(x)\;=-2x^2+16x-24[/latex]
  9. [latex]f(x)\;=\;3x(x+1){(x-1)}^2[/latex]
  10. [latex]f(x)\;=9-4x^2[/latex]
  11. [latex]f(x)\;=-(x-4)(x-3){(x-1)}^2[/latex]
  12. [latex]f(x)\;=-5[/latex]
  13. [latex]f(x)\;=\;x^3(x-3)[/latex]
  14. [latex]f(x)\;=-3(x-1){(x-2)}^2(x-3)[/latex]
  1. A graph of a polynomial function is shown on a Cartesian coordinate system with labeled x and y axes. The x-axis is marked with integers from -2 to 6. The black curve of the function intersects the x-axis at (1,0), (3,0) and (5,0).
  2. A straight black line is plotted on a Cartesian coordinate system with labeled x and y axes. The x-axis ranges from -4 to 4. The line passes through the origin (0, 0) with a positive slope.
  3. A graph of a polynomial function is shown on a Cartesian coordinate system with labeled x and y axes. The x-axis ranges from -4 to 4. The black curve of the function exhibits local extrema. There is a local maximum in the first quadrant and a local minimum in the fourth quadrant. The curve intersects x-axis at (-2,0), (0,0), and (2,0).
  4. A graph on a Cartesian coordinate system with labeled x and y axes. The x-axis ranges from -4 to 4. The curve has two local minima and a local maximum. The curve intersects x axis at (-1,0) and (0,0) and touches x-axis at (1,0).
  5. A graph of a polynomial function is shown on a Cartesian coordinate system with labeled x and y axes. The x-axis ranges from -4 to 4. The black curve of the function intersects the x-axis at (-3,0), (0,0) and (3,0).
  6. A parabola is graphed on a Cartesian coordinate system with labeled x and y axes. The x-axis ranges from 0 to 8. The parabola opens downwards, reaching its maximum value in the first quadrant at x=4 and intersecting the x-axis at (2,0) and (6,0).
  7. A horizontal black line is plotted on a Cartesian coordinate system with labeled x and y axes. The x-axis ranges from 0 to 8. The horizontal line intersects the y-axis below the origin, at y = -5, and extends across the graph.
  8. A Cartesian coordinate system with the x-axis labeled from negative 4 to 4, and the y-axis labeled with tick marks. A black curve representing an algebraic function is plotted on the graph. The curve starts high in the second quadrant, decreases, crosses the x-axis at x=0, then continues to decrease, forming a local minimum in the fourth quadrant, and then increases, crossing the x-axis at x=3.
  9. A Cartesian coordinate system with the x-axis labeled from negative 4 to 4, and the y-axis labeled with tick marks. A black curve is plotted on the graph. The curve starts in the third quadrant, increases, touches the x-axis at (0,0) and makes a local maximum at (0,0), then decreases to a local minimum around x=2 and y=4, and then increases sharply, crossing the x-axis at x=3.
  10. A Cartesian coordinate system with the x-axis labeled from negative 4 to 4, and the y-axis labeled with tick marks. A black curve representing a function is plotted on the graph. The curve starts low in the fourth quadrant, increases, touches the x-axis at x=1, and making a local maximum around x=1, then decreases to a local minimum around x=2, then increases and intersects x-axis at (3,0), making a local maximum and finally decreases, crossing the x-axis at x=4 and extending downwards into the fourth quadrant.
  11. A Cartesian coordinate system with the x-axis labeled from negative 4 to 4, and the y-axis labeled with tick marks. A black curve representing a function is plotted on the graph. The curve starts low in the fourth quadrant, increases, intersects the x-axis at x=1, and making a local maximum, then decreases to a local minimum around x=2 and touches x-axis at (2,0) then increases and bends down to intersects x-axis at (3,0), and extending downwards into the fourth quadrant.
  12. A Cartesian coordinate system with the x-axis labeled from negative 4 to 4, and the y-axis labeled with tick marks. A black curve representing a function is plotted on the graph. The curve starts high in the second quadrant, decreases, touches the x-axis at x=0, then increases to a local maximum then decreases sharply, crossing the x-axis at x=2, forming a local minimum and then increases sharply to intersect x-axis at (4,0) and extending upwards into the first quadrant.
  13. A Cartesian coordinate system with the x-axis labeled from negative 4 to 4, and the y-axis labeled with tick marks. A black curve representing a function is plotted on the graph. The curve starts low in the third quadrant, increases to a local maximum around x=−3 and y=0, then decreases to a local minimum around x=−2, then touches x-axis and makes a maximum at (-1,0), and then decreases sharply, extending downwards into the fourth quadrant.
  14. A Cartesian coordinate system with the x-axis labeled from negative 4 to 4, and the y-axis labeled with tick marks. A black curve representing a downward-opening parabola is plotted on the graph. The parabola's vertex is on the positive y-axis. The curve opens downwards, passing through approximately x=−1.5 and x=1.5 on the x-axis.

License

Icon for the Creative Commons Attribution-NonCommercial-ShareAlike 4.0 International License

College Algebra for Non-STEM Majors Copyright © by Northwest Vista College Mathematics Department is licensed under a Creative Commons Attribution-NonCommercial-ShareAlike 4.0 International License, except where otherwise noted.