
Chapter 2: Psychological Research and APA Style Documentation
2.2 Research Approaches and Study Designs
Learning Objectives
- Differentiate between descriptive, experimental, and correlational research
- Explain the strengths and weaknesses of case studies, naturalistic observation, and surveys
- Describe the strength and weaknesses of archival, longitudinal, and cross-sectional research
- Compare longitudinal and cross-sectional approaches to research
- Explain what a correlation coefficient tells us about the relationship between variables
- Describe why correlation does not mean causation
- Describe the experimental process, including ways to control for bias
- Identify and differentiate between independent and dependent variables
Introduction to Approaches to Research

If you think about the vast array of fields and topics covered in psychology, you understand that in order to do psychological research, there must be a diverse set of ways to gather data and perform experiments. For example, a biological psychologist might work predominately in a lab setting or alongside a neurologist. A social scientist may set up situational experiments, a health psychologist may administer surveys, and a developmental psychologist may make observations in a classroom. In this section, you’ll learn about the various types of research methods that psychologists employ to learn about human behavior.
Psychologists use descriptive, experimental, and correlational methods to conduct research. Descriptive, or qualitative, methods include the case study, naturalistic observation, surveys, archival research, longitudinal research, and cross-sectional research.
Experiments are conducted in order to determine cause-and-effect relationships. In ideal experimental design, the only difference between the experimental and control groups is whether participants are exposed to the experimental manipulation. Each group goes through all phases of the experiment, but each group will experience a different level of the independent variable: the experimental group is exposed to the experimental manipulation, and the control group is not exposed to the experimental manipulation. The researcher then measures the changes that are produced in the dependent variable in each group. Once data is collected from both groups, it is analyzed statistically to determine if there are meaningful differences between the groups.
When scientists passively observe and measure phenomena it is called correlational research. Here, psychologists do not intervene and change behavior, as they do in experiments. In correlational research, they identify patterns of relationships, but usually cannot infer what causes what. Importantly, with correlational research, you can examine only two variables at a time, no more and no less.
Watch It: More on Research
If you enjoy learning through lectures and want an interesting and comprehensive summary of this section, then click on the Youtube link to watch a lecture given by MIT Professor John Gabrieli. Start at the 30:45 minute mark and watch through the end to hear examples of actual psychological studies and how they were analyzed. Listen for references to independent and dependent variables, experimenter bias, and double-blind studies. In the lecture, you’ll learn about breaking social norms, “WEIRD” research, why expectations matter, how a warm cup of coffee might make you nicer, why you should change your answer on a multiple choice test, and why praise for intelligence won’t make you any smarter.
Descriptive Research
There are many research methods available to psychologists in their efforts to understand, describe, and explain behavior and the cognitive and biological processes that underlie it. Some methods rely on observational techniques. Other approaches involve interactions between the researcher and the individuals who are being studied—ranging from a series of simple questions to extensive, in-depth interviews—to well-controlled experiments.
The three main categories of psychological research are descriptive, correlational, and experimental research. Research studies that do not test specific relationships between variables are called descriptive, or qualitative, studies. These studies are used to describe general or specific behaviors and attributes that are observed and measured. In the early stages of research it might be difficult to form a hypothesis, especially when there is not any existing literature in the area. In these situations designing an experiment would be premature, as the question of interest is not yet clearly defined as a hypothesis. Often a researcher will begin with a non-experimental approach, such as a descriptive study, to gather more information about the topic before designing an experiment or correlational study to address a specific hypothesis. Descriptive research is distinct from correlational research, in which psychologists formally test whether a relationship exists between two or more variables. Experimental research goes a step further beyond descriptive and correlational research and randomly assigns people to different conditions, using hypothesis testing to make inferences about how these conditions affect behavior. It aims to determine if one variable directly impacts and causes another. Correlational and experimental research both typically use hypothesis testing, whereas descriptive research does not.
Each of these research methods has unique strengths and weaknesses, and each method may only be appropriate for certain types of research questions. For example, studies that rely primarily on observation produce incredible amounts of information, but the ability to apply this information to the larger population is somewhat limited because of small sample sizes. Survey research, on the other hand, allows researchers to easily collect data from relatively large samples. While this allows for results to be generalized to the larger population more easily, the information that can be collected on any given survey is somewhat limited and subject to problems associated with any type of self-reported data. Some researchers conduct archival research by using existing records. While this can be a fairly inexpensive way to collect data that can provide insight into a number of research questions, researchers using this approach have no control on how or what kind of data was collected.
Correlational research can find a relationship between two variables, but the only way a researcher can claim that the relationship between the variables is cause and effect is to perform an experiment. In experimental research, which will be discussed later in the text, there is a tremendous amount of control over variables of interest. While this is a powerful approach, experiments are often conducted in very artificial settings. This calls into question the validity of experimental findings with regard to how they would apply in real-world settings. In addition, many of the questions that psychologists would like to answer cannot be pursued through experimental research because of ethical concerns.
The three main types of descriptive studies are case studies, naturalistic observation, and surveys.
Try It
Case Studies
In 2011, the New York Times published a feature story on Krista and Tatiana Hogan, Canadian twin girls. These particular twins are unique because Krista and Tatiana are conjoined twins, connected at the head. There is evidence that the two girls are connected in a part of the brain called the thalamus, which is a major sensory relay center. Most incoming sensory information is sent through the thalamus before reaching higher regions of the cerebral cortex for processing.
Link to Learning
To learn more about Krista and Tatiana, watch this video about their lives as conjoined twins.
The implications of this potential connection mean that it might be possible for one twin to experience the sensations of the other twin. For instance, if Krista is watching a particularly funny television program, Tatiana might smile or laugh even if she is not watching the program. This particular possibility has piqued the interest of many neuroscientists who seek to understand how the brain uses sensory information.
These twins represent an enormous resource in the study of the brain, and since their condition is very rare, it is likely that as long as their family agrees, scientists will follow these girls very closely throughout their lives to gain as much information as possible (Dominus, 2011).
In observational research, scientists are conducting a clinical or case study when they focus on one person or just a few individuals. Indeed, some scientists spend their entire careers studying just 10–20 individuals. Why would they do this? Obviously, when they focus their attention on a very small number of people, they can gain a tremendous amount of insight into those cases. The richness of information that is collected in clinical or case studies is unmatched by any other single research method. This allows the researcher to have a very deep understanding of the individuals and the particular phenomenon being studied.
If clinical or case studies provide so much information, why are they not more frequent among researchers? As it turns out, the major benefit of this particular approach is also a weakness. As mentioned earlier, this approach is often used when studying individuals who are interesting to researchers because they have a rare characteristic. Therefore, the individuals who serve as the focus of case studies are not like most other people. If scientists ultimately want to explain all behavior, focusing attention on such a special group of people can make it difficult to generalize any observations to the larger population as a whole. Generalizing refers to the ability to apply the findings of a particular research project to larger segments of society. Again, case studies provide enormous amounts of information, but since the cases are so specific, the potential to apply what’s learned to the average person may be very limited.
Try It
Naturalistic Observation
If you want to understand how behavior occurs, one of the best ways to gain information is to simply observe the behavior in its natural context. However, people might change their behavior in unexpected ways if they know they are being observed. How do researchers obtain accurate information when people tend to hide their natural behavior? As an example, imagine that your professor asks everyone in your class to raise their hand if they always wash their hands after using the restroom. Chances are that almost everyone in the classroom will raise their hand, but do you think hand washing after every trip to the restroom is really that universal?
This is very similar to the phenomenon mentioned earlier in this module: many individuals do not feel comfortable answering a question honestly. But if we are committed to finding out the facts about hand washing, we have other options available to us.
Suppose we send a classmate into the restroom to actually watch whether everyone washes their hands after using the restroom. Will our observer blend into the restroom environment by wearing a white lab coat, sitting with a clipboard, and staring at the sinks? We want our researcher to be inconspicuous—perhaps standing at one of the sinks pretending to put in contact lenses while secretly recording the relevant information. This type of observational study is called naturalistic observation: observing behavior in its natural setting. To better understand peer exclusion, Suzanne Fanger collaborated with colleagues at the University of Texas to observe the behavior of preschool children on a playground. How did the observers remain inconspicuous over the duration of the study? They equipped a few of the children with wireless microphones (which the children quickly forgot about) and observed while taking notes from a distance. Also, the children in that particular preschool (a “laboratory preschool”) were accustomed to having observers on the playground (Fanger, Frankel, & Hazen, 2012).

It is critical that the observer be as unobtrusive and as inconspicuous as possible: when people know they are being watched, they are less likely to behave naturally. If you have any doubt about this, ask yourself how your driving behavior might differ in two situations: In the first situation, you are driving down a deserted highway during the middle of the day; in the second situation, you are being followed by a police car down the same deserted highway (Figure 1).
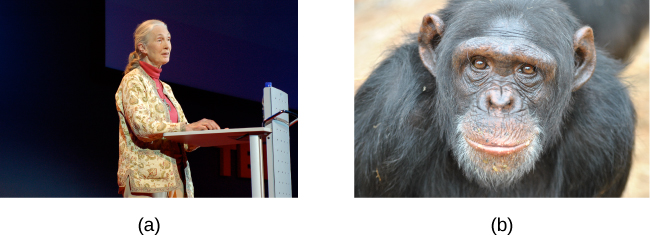
It should be pointed out that naturalistic observation is not limited to research involving humans. Indeed, some of the best-known examples of naturalistic observation involve researchers going into the field to observe various kinds of animals in their own environments. As with human studies, the researchers maintain their distance and avoid interfering with the animal subjects so as not to influence their natural behaviors. Scientists have used this technique to study social hierarchies and interactions among animals ranging from ground squirrels to gorillas. The information provided by these studies is invaluable in understanding how those animals organize socially and communicate with one another. The anthropologist Jane Goodall, for example, spent nearly five decades observing the behavior of chimpanzees in Africa (Figure 2). As an illustration of the types of concerns that a researcher might encounter in naturalistic observation, some scientists criticized Goodall for giving the chimps names instead of referring to them by numbers—using names was thought to undermine the emotional detachment required for the objectivity of the study (McKie, 2010).
The greatest benefit of naturalistic observation is the validity, or accuracy, of information collected unobtrusively in a natural setting. Having individuals behave as they normally would in a given situation means that we have a higher degree of ecological validity, or realism, than we might achieve with other research approaches. Therefore, our ability to generalize the findings of the research to real-world situations is enhanced. If done correctly, we need not worry about people or animals modifying their behavior simply because they are being observed. Sometimes, people may assume that reality programs give us a glimpse into authentic human behavior. However, the principle of inconspicuous observation is violated as reality stars are followed by camera crews and are interviewed on camera for personal confessionals. Given that environment, we must doubt how natural and realistic their behaviors are.
The major downside of naturalistic observation is that they are often difficult to set up and control. In our restroom study, what if you stood in the restroom all day prepared to record people’s hand washing behavior and no one came in? Or, what if you have been closely observing a troop of gorillas for weeks only to find that they migrated to a new place while you were sleeping in your tent? The benefit of realistic data comes at a cost. As a researcher you have no control of when (or if) you have behavior to observe. In addition, this type of observational research often requires significant investments of time, money, and a good dose of luck.
Sometimes studies involve structured observation. In these cases, people are observed while engaging in set, specific tasks. An excellent example of structured observation comes from Strange Situation by Mary Ainsworth (you will read more about this in the module on lifespan development). The Strange Situation is a procedure used to evaluate attachment styles that exist between an infant and caregiver. In this scenario, caregivers bring their infants into a room filled with toys. The Strange Situation involves a number of phases, including a stranger coming into the room, the caregiver leaving the room, and the caregiver’s return to the room. The infant’s behavior is closely monitored at each phase, but it is the behavior of the infant upon being reunited with the caregiver that is most telling in terms of characterizing the infant’s attachment style with the caregiver.
Another potential problem in observational research is observer bias. Generally, people who act as observers are closely involved in the research project and may unconsciously skew their observations to fit their research goals or expectations. To protect against this type of bias, researchers should have clear criteria established for the types of behaviors recorded and how those behaviors should be classified. In addition, researchers often compare observations of the same event by multiple observers, in order to test inter-rater reliability: a measure of reliability that assesses the consistency of observations by different observers.
Try It
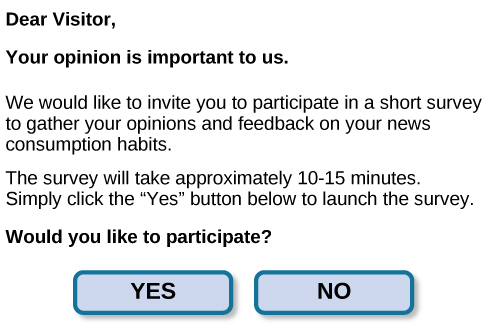
Surveys
Often, psychologists develop surveys as a means of gathering data. Surveys are lists of questions to be answered by research participants, and can be delivered as paper-and-pencil questionnaires, administered electronically, or conducted verbally (Figure 3). Generally, the survey itself can be completed in a short time, and the ease of administering a survey makes it easy to collect data from a large number of people.
Surveys allow researchers to gather data from larger samples than may be afforded by other research methods. A sample is a subset of individuals selected from a population, which is the overall group of individuals that the researchers are interested in. Researchers study the sample and seek to generalize their findings to the population.
There is both strength and weakness of the survey in comparison to case studies. By using surveys, we can collect information from a larger sample of people. A larger sample is better able to reflect the actual diversity of the population, thus allowing better generalizability. Therefore, if our sample is sufficiently large and diverse, we can assume that the data we collect from the survey can be generalized to the larger population with more certainty than the information collected through a case study. However, given the greater number of people involved, we are not able to collect the same depth of information on each person that would be collected in a case study.
Another potential weakness of surveys is something we touched on earlier in this module: people don’t always give accurate responses. They may lie, misremember, or answer questions in a way that they think makes them look good. For example, people may report drinking less alcohol than is actually the case.
Any number of research questions can be answered through the use of surveys. One real-world example is the research conducted by Jenkins, Ruppel, Kizer, Yehl, and Griffin (2012) about the backlash against the US Arab-American community following the terrorist attacks of September 11, 2001. Jenkins and colleagues wanted to determine to what extent these negative attitudes toward Arab-Americans still existed nearly a decade after the attacks occurred. In one study, 140 research participants filled out a survey with 10 questions, including questions asking directly about the participant’s overt prejudicial attitudes toward people of various ethnicities. The survey also asked indirect questions about how likely the participant would be to interact with a person of a given ethnicity in a variety of settings (such as, “How likely do you think it is that you would introduce yourself to a person of Arab-American descent?”). The results of the research suggested that participants were unwilling to report prejudicial attitudes toward any ethnic group. However, there were significant differences between their pattern of responses to questions about social interaction with Arab-Americans compared to other ethnic groups: they indicated less willingness for social interaction with Arab-Americans compared to the other ethnic groups. This suggested that the participants harbored subtle forms of prejudice against Arab-Americans, despite their assertions that this was not the case (Jenkins et al., 2012).
Try It
Think It Over
A friend of yours is working part-time in a local pet store. Your friend has become increasingly interested in how dogs normally communicate and interact with each other, and is thinking of visiting a local veterinary clinic to see how dogs interact in the waiting room. After reading this section, do you think this is the best way to better understand such interactions? Do you have any suggestions that might result in more valid data?
Other Types of Descriptive Research
Other types of descriptive research include archival research and longitudinal and cross-sectional studies.
Archival Research
Some researchers gain access to large amounts of data without interacting with a single research participant. Instead, they use existing records to answer various research questions. This type of research approach is known as archival research. Archival research relies on looking at past records or data sets to look for interesting patterns or relationships.
For example, a researcher might access the academic records of all individuals who enrolled in college within the past ten years and calculate how long it took them to complete their degrees, as well as course loads, grades, and extracurricular involvement. Archival research could provide important information about who is most likely to complete their education, and it could help identify important risk factors for struggling students (Figure 1).
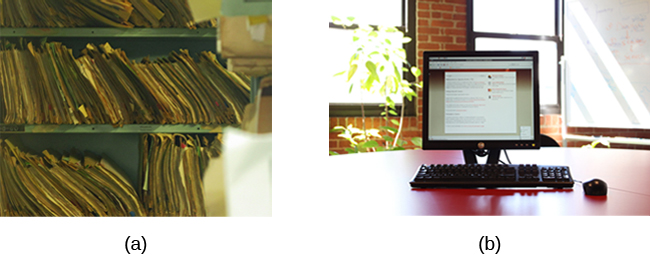
In comparing archival research to other research methods, there are several important distinctions. For one, the researcher employing archival research never directly interacts with research participants. Therefore, the investment of time and money to collect data is considerably less with archival research. Additionally, researchers have no control over what information was originally collected. Therefore, research questions have to be tailored so they can be answered within the structure of the existing data sets. There is also no guarantee of consistency between the records from one source to another, which might make comparing and contrasting different data sets problematic.
Longitudinal and Cross-Sectional Research
Sometimes we want to see how people change over time, as in studies of human development and lifespan. When we test the same group of individuals repeatedly over an extended period of time, we are conducting longitudinal research. Longitudinal research is a research design in which data-gathering is administered repeatedly over an extended period of time. For example, we may survey a group of individuals about their dietary habits at age 20, retest them a decade later at age 30, and then again at age 40.
Another approach is cross-sectional research. In cross-sectional research, a researcher compares multiple segments of the population at the same time. Using the dietary habits example above, the researcher might directly compare different groups of people by age. Instead of observing a group of people for 20 years to see how their dietary habits changed from decade to decade, the researcher would study a group of 20-year-old individuals and compare them to a group of 30-year-old individuals and a group of 40-year-old individuals. While cross-sectional research requires a shorter-term investment, it is also limited by differences that exist between the different generations (or cohorts) that have nothing to do with age per se, but rather reflect the social and cultural experiences of different generations of individuals make them different from one another.
To illustrate this concept, consider the following survey findings. In recent years there has been significant growth in the popular support of same-sex marriage. Many studies on this topic break down survey participants into different age groups. In general, younger people are more supportive of same-sex marriage than are those who are older (Jones, 2013). Does this mean that as we age we become less open to the idea of same-sex marriage, or does this mean that older individuals have different perspectives because of the social climates in which they grew up? Longitudinal research is a powerful approach because the same individuals are involved in the research project over time, which means that the researchers need to be less concerned with differences among cohorts affecting the results of their study.
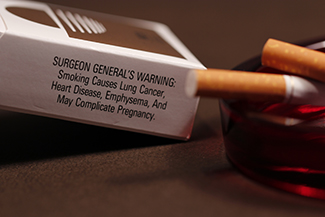
Often longitudinal studies are employed when researching various diseases in an effort to understand particular risk factors. Such studies often involve tens of thousands of individuals who are followed for several decades. Given the enormous number of people involved in these studies, researchers can feel confident that their findings can be generalized to the larger population. The Cancer Prevention Study-3 (CPS-3) is one of a series of longitudinal studies sponsored by the American Cancer Society aimed at determining predictive risk factors associated with cancer. When participants enter the study, they complete a survey about their lives and family histories, providing information on factors that might cause or prevent the development of cancer. Then every few years the participants receive additional surveys to complete. In the end, hundreds of thousands of participants will be tracked over 20 years to determine which of them develop cancer and which do not.
Clearly, this type of research is important and potentially very informative. For instance, earlier longitudinal studies sponsored by the American Cancer Society provided some of the first scientific demonstrations of the now well-established links between increased rates of cancer and smoking (American Cancer Society, n.d.) (Figure 2).
As with any research strategy, longitudinal research is not without limitations. For one, these studies require an incredible time investment by the researcher and research participants. Given that some longitudinal studies take years, if not decades, to complete, the results will not be known for a considerable period of time. In addition to the time demands, these studies also require a substantial financial investment. Many researchers are unable to commit the resources necessary to see a longitudinal project through to the end.
Research participants must also be willing to continue their participation for an extended period of time, and this can be problematic. People move, get married and take new names, get ill, and eventually die. Even without significant life changes, some people may simply choose to discontinue their participation in the project. As a result, the attrition rates, or reduction in the number of research participants due to dropouts, in longitudinal studies are quite high and increases over the course of a project. For this reason, researchers using this approach typically recruit many participants fully expecting that a substantial number will drop out before the end. As the study progresses, they continually check whether the sample still represents the larger population, and make adjustments as necessary.
Try It
Correlational Research
Did you know that as sales in ice cream increase, so does the overall rate of crime? Is it possible that indulging in your favorite flavor of ice cream could send you on a crime spree? Or, after committing crime do you think you might decide to treat yourself to a cone? There is no question that a relationship exists between ice cream and crime (e.g., Harper, 2013), but it would be pretty foolish to decide that one thing actually caused the other to occur.
It is much more likely that both ice cream sales and crime rates are related to the temperature outside. When the temperature is warm, there are lots of people out of their houses, interacting with each other, getting annoyed with one another, and sometimes committing crimes. Also, when it is warm outside, we are more likely to seek a cool treat like ice cream. How do we determine if there is indeed a relationship between two things? And when there is a relationship, how can we discern whether it is attributable to coincidence or causation?
Correlational Research
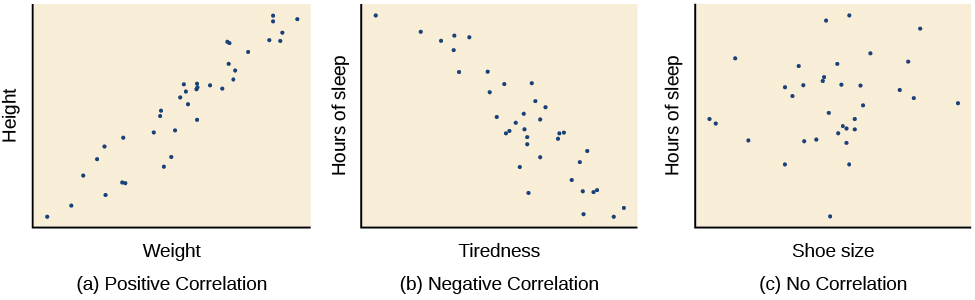
Correlation means that there is a relationship between two or more variables (such as ice cream consumption and crime), but this relationship does not necessarily imply cause and effect. When two variables are correlated, it simply means that as one variable changes, so does the other. We can measure correlation by calculating a statistic known as a correlation coefficient. A correlation coefficient is a number from -1 to +1 that indicates the strength and direction of the relationship between variables. The correlation coefficient is usually represented by the letter r.
The number portion of the correlation coefficient indicates the strength of the relationship. The closer the number is to 1 (be it negative or positive), the more strongly related the variables are, and the more predictable changes in one variable will be as the other variable changes. The closer the number is to zero, the weaker the relationship, and the less predictable the relationships between the variables becomes. For instance, a correlation coefficient of 0.9 indicates a far stronger relationship than a correlation coefficient of 0.3. If the variables are not related to one another at all, the correlation coefficient is 0. The example above about ice cream and crime is an example of two variables that we might expect to have no relationship to each other.
The sign—positive or negative—of the correlation coefficient indicates the direction of the relationship (Figure 1). A positive correlation means that the variables move in the same direction. Put another way, it means that as one variable increases so does the other, and conversely, when one variable decreases so does the other. A negative correlation means that the variables move in opposite directions. If two variables are negatively correlated, a decrease in one variable is associated with an increase in the other and vice versa.
The example of ice cream and crime rates is a positive correlation because both variables increase when temperatures are warmer. Other examples of positive correlations are the relationship between an individual’s height and weight or the relationship between a person’s age and number of wrinkles. One might expect a negative correlation to exist between someone’s tiredness during the day and the number of hours they slept the previous night: the amount of sleep decreases as the feelings of tiredness increase. In a real-world example of negative correlation, student researchers at the University of Minnesota found a weak negative correlation (r = -0.29) between the average number of days per week that students got fewer than 5 hours of sleep and their GPA (Lowry, Dean, & Manders, 2010). Keep in mind that a negative correlation is not the same as no correlation. For example, we would probably find no correlation between hours of sleep and shoe size.
As mentioned earlier, correlations have predictive value. Imagine that you are on the admissions committee of a major university. You are faced with a huge number of applications, but you are able to accommodate only a small percentage of the applicant pool. How might you decide who should be admitted? You might try to correlate your current students’ college GPA with their scores on standardized tests like the SAT or ACT. By observing which correlations were strongest for your current students, you could use this information to predict relative success of those students who have applied for admission into the university.
Correlation Does Not Indicate Causation
Correlational research is useful because it allows us to discover the strength and direction of relationships that exist between two variables. However, correlation is limited because establishing the existence of a relationship tells us little about cause and effect. While variables are sometimes correlated because one does cause the other, it could also be that some other factor, a confounding variable, is actually causing the systematic movement in our variables of interest. In the ice cream/crime rate example mentioned earlier, temperature is a confounding variable that could account for the relationship between the two variables.
Even when we cannot point to clear confounding variables, we should not assume that a correlation between two variables implies that one variable causes changes in another. This can be frustrating when a cause-and-effect relationship seems clear and intuitive. Think back to our discussion of the research done by the American Cancer Society and how their research projects were some of the first demonstrations of the link between smoking and cancer. It seems reasonable to assume that smoking causes cancer, but if we were limited to correlational research, we would be overstepping our bounds by making this assumption.
Unfortunately, people mistakenly make claims of causation as a function of correlations all the time. Such claims are especially common in advertisements and news stories. For example, recent research found that people who eat cereal on a regular basis achieve healthier weights than those who rarely eat cereal (Frantzen, Treviño, Echon, Garcia-Dominic, & DiMarco, 2013; Barton et al., 2005). Guess how the cereal companies report this finding. Does eating cereal really cause an individual to maintain a healthy weight, or are there other possible explanations, such as, someone at a healthy weight is more likely to regularly eat a healthy breakfast than someone who is obese or someone who avoids meals in an attempt to diet (Figure 2)? While correlational research is invaluable in identifying relationships among variables, a major limitation is the inability to establish causality. Psychologists want to make statements about cause and effect, but the only way to do that is to conduct an experiment to answer a research question. The next section describes how scientific experiments incorporate methods that eliminate, or control for, alternative explanations, which allow researchers to explore how changes in one variable cause changes in another variable.
Try It
Watch It
Watch this clip from Freakonomics for an example of how correlation does not indicate causation.
You can view the transcript for “Correlation vs. Causality: Freakonomics Movie” here (opens in new window).

Illusory Correlations
The temptation to make erroneous cause-and-effect statements based on correlational research is not the only way we tend to misinterpret data. We also tend to make the mistake of illusory correlations, especially with unsystematic observations. Illusory correlations, or false correlations, occur when people believe that relationships exist between two things when no such relationship exists. One well-known illusory correlation is the supposed effect that the moon’s phases have on human behavior. Many people passionately assert that human behavior is affected by the phase of the moon, and specifically, that people act strangely when the moon is full (Figure 3).

There is no denying that the moon exerts a powerful influence on our planet. The ebb and flow of the ocean’s tides are tightly tied to the gravitational forces of the moon. Many people believe, therefore, that it is logical that we are affected by the moon as well. After all, our bodies are largely made up of water. A meta-analysis of nearly 40 studies consistently demonstrated, however, that the relationship between the moon and our behavior does not exist (Rotton & Kelly, 1985). While we may pay more attention to odd behavior during the full phase of the moon, the rates of odd behavior remain constant throughout the lunar cycle.
Why are we so apt to believe in illusory correlations like this? Often we read or hear about them and simply accept the information as valid. Or, we have a hunch about how something works and then look for evidence to support that hunch, ignoring evidence that would tell us our hunch is false; this is known as confirmation bias. Other times, we find illusory correlations based on the information that comes most easily to mind, even if that information is severely limited. And while we may feel confident that we can use these relationships to better understand and predict the world around us, illusory correlations can have significant drawbacks. For example, research suggests that illusory correlations—in which certain behaviors are inaccurately attributed to certain groups—are involved in the formation of prejudicial attitudes that can ultimately lead to discriminatory behavior (Fiedler, 2004).
Think It Over
We all have a tendency to make illusory correlations from time to time. Try to think of an illusory correlation that is held by you, a family member, or a close friend. How do you think this illusory correlation came about and what can be done in the future to combat them?
Experiments
Causality: Conducting Experiments and Using the Data
Experimental Hypothesis
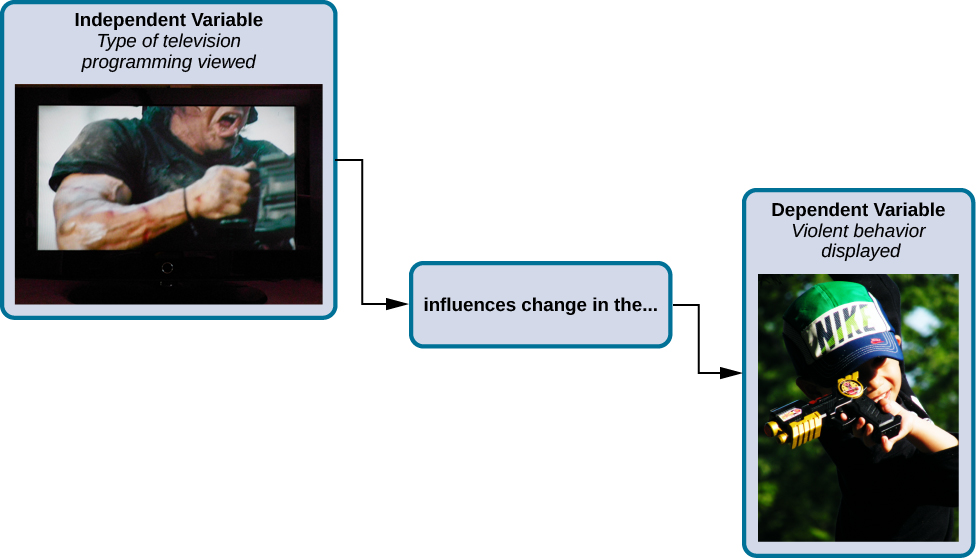
In order to conduct an experiment, a researcher must have a specific hypothesis to be tested. As you’ve learned, hypotheses can be formulated either through direct observation of the real world or after careful review of previous research. For example, if you think that children should not be allowed to watch violent programming on television because doing so would cause them to behave more violently, then you have basically formulated a hypothesis—namely, that watching violent television programs causes children to behave more violently. How might you have arrived at this particular hypothesis? You may have younger relatives who watch cartoons featuring characters using martial arts to save the world from evildoers, with an impressive array of punching, kicking, and defensive postures. You notice that after watching these programs for a while, your young relatives mimic the fighting behavior of the characters portrayed in the cartoon (Figure 1).

These sorts of personal observations are what often lead us to formulate a specific hypothesis, but we cannot use limited personal observations and anecdotal evidence to rigorously test our hypothesis. Instead, to find out if real-world data supports our hypothesis, we have to conduct an experiment.
Designing an Experiment
The most basic experimental design involves two groups: the experimental group and the control group. The two groups are designed to be the same except for one difference— experimental manipulation. The experimental group gets the experimental manipulation—that is, the treatment or variable being tested (in this case, violent TV images)—and the control group does not. Since experimental manipulation is the only difference between the experimental and control groups, we can be sure that any differences between the two are due to experimental manipulation rather than chance.
In our example of how violent television programming might affect violent behavior in children, we have the experimental group view violent television programming for a specified time and then measure their violent behavior. We measure the violent behavior in our control group after they watch nonviolent television programming for the same amount of time. It is important for the control group to be treated similarly to the experimental group, with the exception that the control group does not receive the experimental manipulation. Therefore, we have the control group watch non-violent television programming for the same amount of time as the experimental group.
We also need to precisely define, or operationalize, what is considered violent and nonviolent. An operational definition is a description of how we will measure our variables, and it is important in allowing others understand exactly how and what a researcher measures in a particular experiment. In operationalizing violent behavior, we might choose to count only physical acts like kicking or punching as instances of this behavior, or we also may choose to include angry verbal exchanges. Whatever we determine, it is important that we operationalize violent behavior in such a way that anyone who hears about our study for the first time knows exactly what we mean by violence. This aids peoples’ ability to interpret our data as well as their capacity to repeat our experiment should they choose to do so.
Once we have operationalized what is considered violent television programming and what is considered violent behavior from our experiment participants, we need to establish how we will run our experiment. In this case, we might have participants watch a 30-minute television program (either violent or nonviolent, depending on their group membership) before sending them out to a playground for an hour where their behavior is observed and the number and type of violent acts is recorded.
Ideally, the people who observe and record the children’s behavior are unaware of who was assigned to the experimental or control group, in order to control for experimenter bias. Experimenter bias refers to the possibility that a researcher’s expectations might skew the results of the study. Remember, conducting an experiment requires a lot of planning, and the people involved in the research project have a vested interest in supporting their hypotheses. If the observers knew which child was in which group, it might influence how much attention they paid to each child’s behavior as well as how they interpreted that behavior. By being blind to which child is in which group, we protect against those biases. This situation is a single-blind study, meaning that one of the groups (participants) are unaware as to which group they are in (experiment or control group) while the researcher who developed the experiment knows which participants are in each group.
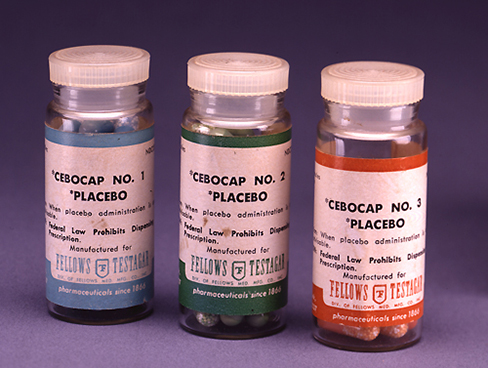
In a double-blind study, both the researchers and the participants are blind to group assignments. Why would a researcher want to run a study where no one knows who is in which group? Because by doing so, we can control for both experimenter and participant expectations. If you are familiar with the phrase placebo effect, you already have some idea as to why this is an important consideration. The placebo effect occurs when people’s expectations or beliefs influence or determine their experience in a given situation. In other words, simply expecting something to happen can actually make it happen.
The placebo effect is commonly described in terms of testing the effectiveness of a new medication. Imagine that you work in a pharmaceutical company, and you think you have a new drug that is effective in treating depression. To demonstrate that your medication is effective, you run an experiment with two groups: The experimental group receives the medication, and the control group does not. But you don’t want participants to know whether they received the drug or not.
Why is that? Imagine that you are a participant in this study, and you have just taken a pill that you think will improve your mood. Because you expect the pill to have an effect, you might feel better simply because you took the pill and not because of any drug actually contained in the pill—this is the placebo effect.
To make sure that any effects on mood are due to the drug and not due to expectations, the control group receives a placebo (in this case a sugar pill). Now everyone gets a pill, and once again neither the researcher nor the experimental participants know who got the drug and who got the sugar pill. Any differences in mood between the experimental and control groups can now be attributed to the drug itself rather than to experimenter bias or participant expectations (Figure 2).
Try It
Independent and Dependent Variables
In a research experiment, we strive to study whether changes in one thing cause changes in another. To achieve this, we must pay attention to two important variables, or things that can be changed, in any experimental study: the independent variable and the dependent variable. An independent variable is manipulated or controlled by the experimenter. In a well-designed experimental study, the independent variable is the only important difference between the experimental and control groups. In our example of how violent television programs affect children’s display of violent behavior, the independent variable is the type of program—violent or nonviolent—viewed by participants in the study (Figure 3). A dependent variable is what the researcher measures to see how much effect the independent variable had. In our example, the dependent variable is the number of violent acts displayed by the experimental participants.
We expect that the dependent variable will change as a function of the independent variable. In other words, the dependent variable depends on the independent variable. A good way to think about the relationship between the independent and dependent variables is with this question: What effect does the independent variable have on the dependent variable? Returning to our example, what effect does watching a half hour of violent television programming or nonviolent television programming have on the number of incidents of physical aggression displayed on the playground?
Try It
Selecting and Assigning Experimental Participants
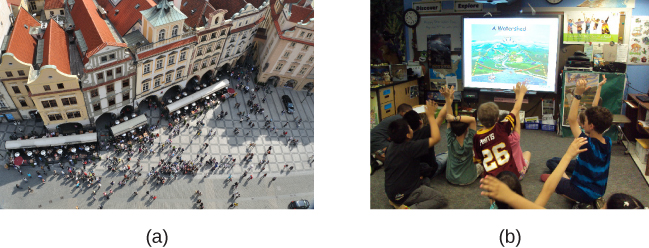
Now that our study is designed, we need to obtain a sample of individuals to include in our experiment. Our study involves human participants so we need to determine who to include. Participants are the subjects of psychological research, and as the name implies, individuals who are involved in psychological research actively participate in the process. Often, psychological research projects rely on college students to serve as participants. In fact, the vast majority of research in psychology subfields has historically involved students as research participants (Sears, 1986; Arnett, 2008). But are college students truly representative of the general population? College students tend to be younger, more educated, more liberal, and less diverse than the general population. Although using students as test subjects is an accepted practice, relying on such a limited pool of research participants can be problematic because it is difficult to generalize findings to the larger population.
Our hypothetical experiment involves children, and we must first generate a sample of child participants. Samples are used because populations are usually too large to reasonably involve every member in our particular experiment (Figure 4). If possible, we should use a random sample (there are other types of samples, but for the purposes of this section, we will focus on random samples). A random sample is a subset of a larger population in which every member of the population has an equal chance of being selected. Random samples are preferred because if the sample is large enough we can be reasonably sure that the participating individuals are representative of the larger population. This means that the percentages of characteristics in the sample—sex, ethnicity, socioeconomic level, and any other characteristics that might affect the results—are close to those percentages in the larger population.
In our example, let’s say we decide our population of interest is fourth graders. But all fourth graders is a very large population, so we need to be more specific; instead we might say our population of interest is all fourth graders in a particular city. We should include students from various income brackets, family situations, races, ethnicities, religions, and geographic areas of town. With this more manageable population, we can work with the local schools in selecting a random sample of around 200 fourth graders who we want to participate in our experiment.
In summary, because we cannot test all of the fourth graders in a city, we want to find a group of about 200 that reflects the composition of that city. With a representative group, we can generalize our findings to the larger population without fear of our sample being biased in some way.
Now that we have a sample, the next step of the experimental process is to split the participants into experimental and control groups through random assignment. With random assignment, all participants have an equal chance of being assigned to either group. There is statistical software that will randomly assign each of the fourth graders in the sample to either the experimental or the control group.
Random assignment is critical for sound experimental design. With sufficiently large samples, random assignment makes it unlikely that there are systematic differences between the groups. So, for instance, it would be very unlikely that we would get one group composed entirely of males, a given ethnic identity, or a given religious ideology. This is important because if the groups were systematically different before the experiment began, we would not know the origin of any differences we find between the groups: Were the differences preexisting, or were they caused by manipulation of the independent variable? Random assignment allows us to assume that any differences observed between experimental and control groups result from the manipulation of the independent variable.
Try It
Issues to Consider
While experiments allow scientists to make cause-and-effect claims, they are not without problems. True experiments require the experimenter to manipulate an independent variable, and that can complicate many questions that psychologists might want to address. For instance, imagine that you want to know what effect sex (the independent variable) has on spatial memory (the dependent variable). Although you can certainly look for differences between males and females on a task that taps into spatial memory, you cannot directly control a person’s sex. We categorize this type of research approach as quasi-experimental and recognize that we cannot make cause-and-effect claims in these circumstances.
Experimenters are also limited by ethical constraints. For instance, you would not be able to conduct an experiment designed to determine if experiencing abuse as a child leads to lower levels of self-esteem among adults. To conduct such an experiment, you would need to randomly assign some experimental participants to a group that receives abuse, and that experiment would be unethical.
Try It
Licenses and Attributions (Click to expand)
CC licensed content, Original
- Introductory content. Provided by: Lumen Learning. License: CC BY-NC-SA: Attribution-NonCommercial-ShareAlike
- Modification and adaptation. Provided by: Lumen Learning. License: CC BY: Attribution
- Modification and adaptation. Provided by: Lumen Learning. License: CC BY-SA: Attribution-ShareAlike
- Research Review. Authored by: Jessica Traylor for Lumen Learning. License: CC BY: Attribution
CC licensed content, Shared previously
- Paragraph on correlation. Authored by: Christie Napa Scollon. Provided by: Singapore Management University. Located at: http://nobaproject.com/modules/research-designs?r=MTc0ODYsMjMzNjQ%3D. Project: The Noba Project. License: CC BY-NC-SA: Attribution-NonCommercial-ShareAlike
- Psychology. Authored by: OpenStax College. Located at: https://openstax.org/books/psychology-2e/pages/2-introduction. License: CC BY: Attribution. License Terms: Download for free at https://openstax.org/books/psychology-2e/pages/1-introduction
- Lec 2 | MIT 9.00SC Introduction to Psychology, Spring 2011. Authored by: John Gabrieli. Provided by: MIT OpenCourseWare. Located at: https://www.youtube.com/watch?v=syXplPKQb_o. License: CC BY-NC-SA: Attribution-NonCommercial-ShareAlike
- Approaches to Research. Authored by: OpenStax College. Located at: https://openstax.org/books/psychology-2e/pages/2-2-approaches-to-research. License: CC BY: Attribution. License Terms: Download for free at https://openstax.org/books/psychology-2e/pages/1-introduction.
- Descriptive Research. Provided by: Boundless. Located at: https://www.boundless.com/psychology/textbooks/boundless-psychology-textbook/researching-psychology-2/types-of-research-studies-27/descriptive-research-124-12659/. License: CC BY-SA: Attribution-ShareAlike
- Analyzing Findings. Authored by: OpenStax College. Located at: https://openstax.org/books/psychology-2e/pages/2-3-analyzing-findings. License: CC BY: Attribution. License Terms: Download for free at https://openstax.org/books/psychology-2e/pages/1-introduction.
Public domain content
- Researchers review documents. Authored by: National Cancer Institute. Provided by: Wikimedia. Located at: https://commons.wikimedia.org/wiki/File:Researchers_review_documents.jpg. License: Public Domain: No Known Copyright
All rights reserved content
- Correlation vs. Causality: Freakonomics Movie. Located at: https://www.youtube.com/watch?v=lbODqslc4Tg. License: Other. License Terms: Standard YouTube License
research studies that do not test specific relationships between variables; they are used to describe general or specific behaviors and attributes that are observed and measured
tests whether a relationship exists between two or more variables
tests a hypothesis to determine cause and effect relationships
observational research study focusing on one or a few people
observation of behavior in its natural setting
inferring that the results for a sample apply to the larger population
when observations may be skewed to align with observer expectations
measure of agreement among observers on how they record and classify a particular event
list of questions to be answered by research participants—given as paper-and-pencil questionnaires, administered electronically, or conducted verbally—allowing researchers to collect data from a large number of people
the collection of individuals on which we collect data.
a larger collection of individuals that we would like to generalize our results to.
method of research using past records or data sets to answer various research questions, or to search for interesting patterns or relationships
studies in which the same group of individuals is surveyed or measured repeatedly over an extended period of time
compares multiple segments of a population at a single time
reduction in number of research participants as some drop out of the study over time
relationship between two or more variables; when two variables are correlated, one variable changes as the other does
number from -1 to +1, indicating the strength and direction of the relationship between variables, and usually represented by r
two variables change in the same direction, both becoming either larger or smaller
two variables change in different directions, with one becoming larger as the other becomes smaller; a negative correlation is not the same thing as no correlation
related to whether we say one variable is causing changes in the other variable, versus other variables that may be related to these two variables.
unanticipated outside factor that affects both variables of interest, often giving the false impression that changes in one variable causes changes in the other variable, when, in actuality, the outside factor causes changes in both variables
changes in one variable cause the changes in the other variable; can be determined only through an experimental research design
seeing relationships between two things when in reality no such relationship exists
seeking out information that supports our stereotypes while ignoring information that is inconsistent with our stereotypes
group designed to answer the research question; experimental manipulation is the only difference between the experimental and control groups, so any differences between the two are due to experimental manipulation rather than chance
description of what actions and operations will be used to measure the dependent variables and manipulate the independent variables
researcher expectations skew the results of the study
experiment in which the researcher knows which participants are in the experimental group and which are in the control group
experiment in which both the researchers and the participants are blind to group assignments
people's expectations or beliefs influencing or determining their experience in a given situation
variable that is influenced or controlled by the experimenter; in a sound experimental study, the independent variable is the only important difference between the experimental and control group
variable that the researcher measures to see how much effect the independent variable had
subjects of psychological research
using a probability-based method to select a subset of individuals for the sample from the population.
using a probability-based method to divide a sample into treatment groups.
