
Chapter 6: Sensation and Perception-Part 2
6.1 Perception Concepts
Learning Objectives
- Give examples of gestalt principles, including the figure-ground relationship, proximity, similarity, continuity, and closure
- Define the basic terminology and basic principles of multimodal perception
- Give examples of multimodal and crossmodal behavioral effects
- Explain how and why psychologists use illusions
- Apply the Ebbinghaus illusion to golf and describe Jessica Witt’s research
Introduction to Perception
What you’ll learn to do: define perception and give examples of gestalt principles and multimodal perception
Seeing something is not the same thing as making sense of what you see. Why is it that our senses are so easily fooled? In this section, you will come to see how our perceptions are not infallible, and they can be influenced by bias, prejudice, and other factors. Psychologists are interested in how these false perceptions influence our thoughts and behavior.
Watch It
Watch this CrashCourse video for a good overview of perception:
Gestalt Principles of Perception
In the early part of the 20th century, Max Wertheimer published a paper demonstrating that individuals perceived motion in rapidly flickering static images—an insight that came to him as he used a child’s toy tachistoscope. Wertheimer, and his assistants Wolfgang Köhler and Kurt Koffka, who later became his partners, believed that perception involved more than simply combining sensory stimuli. This belief led to a new movement within the field of psychology known as Gestalt psychology. The word gestalt literally means form or pattern, but its use reflects the idea that the whole is different from the sum of its parts. In other words, the brain creates a perception that is more than simply the sum of available sensory inputs, and it does so in predictable ways. Gestalt psychologists translated these predictable ways into principles by which we organize sensory information. As a result, Gestalt psychology has been extremely influential in the area of sensation and perception (Rock & Palmer, 1990).
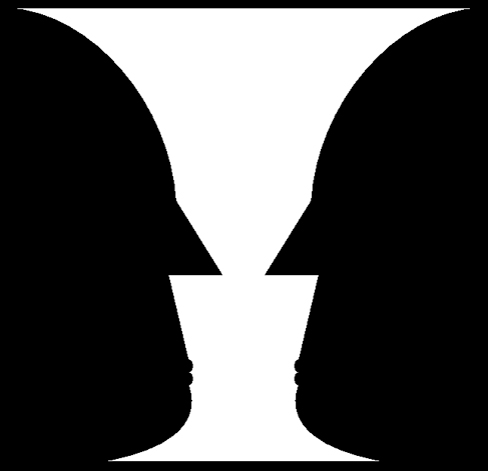
One Gestalt principle is the figure-ground relationship. According to this principle, we tend to segment our visual world into figure and ground. Figure is the object or person that is the focus of the visual field, while the ground is the background. As Figure 1 shows, our perception can vary tremendously, depending on what is perceived as figure and what is perceived as ground. Presumably, our ability to interpret sensory information depends on what we label as figure and what we label as ground in any particular case, although this assumption has been called into question (Peterson & Gibson, 1994; Vecera & O’Reilly, 1998).
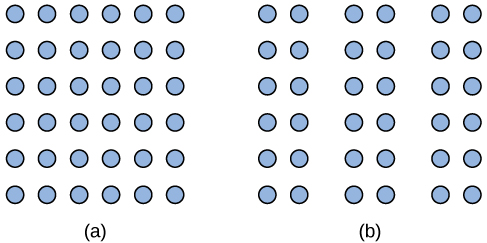
Another Gestalt principle for organizing sensory stimuli into meaningful perception is proximity. This principle asserts that things that are close to one another tend to be grouped together, as Figure 2 illustrates.
How we read something provides another illustration of the proximity concept. For example, we read this sentence like this, notl iket hiso rt hat. We group the letters of a given word together because there are no spaces between the letters, and we perceive words because there are spaces between each word. Here are some more examples: Cany oum akes enseo ft hiss entence? What doth es e wor dsmea n?
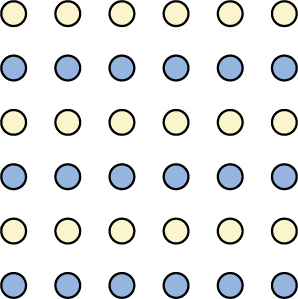
We might also use the principle of similarity to group things in our visual fields. According to this principle, things that are alike tend to be grouped together (Figure 3). For example, when watching a football game, we tend to group individuals based on the colors of their uniforms. When watching an offensive drive, we can get a sense of the two teams simply by grouping along this dimension.
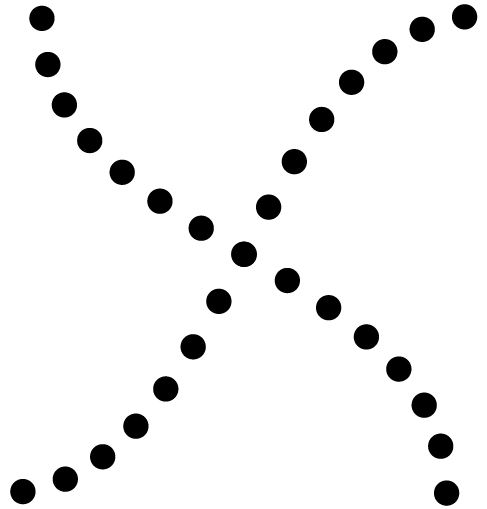
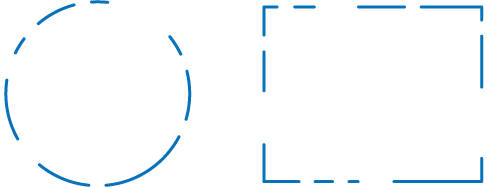
Two additional Gestalt principles are the law of continuity (or good continuation) and closure. The law of continuity suggests that we are more likely to perceive continuous, smooth flowing lines rather than jagged, broken lines (Figure 4). The principle of closure states that we organize our perceptions into complete objects rather than as a series of parts (Figure 5).
Link to Learning
Watch this podcast showing real world illustrations of Gestalt principles.
According to Gestalt theorists, pattern perception, or our ability to discriminate among different figures and shapes, occurs by following the principles described above. You probably feel fairly certain that your perception accurately matches the real world, but this is not always the case. Our perceptions are based on perceptual hypotheses: educated guesses that we make while interpreting sensory information. These hypotheses are informed by a number of factors, including our personalities, experiences, and expectations. We use these hypotheses to generate our perceptual set. For instance, research has demonstrated that those who are given verbal priming produce a biased interpretation of complex ambiguous figures (Goolkasian & Woodbury, 2010).
Dig Deeper: The Depths of Perception: Bias, Prejudice, and Cultural Factors
In this module, you have learned that perception is a complex process. Built from sensations, but influenced by our own experiences, biases, prejudices, and cultures, perceptions can be very different from person to person. Research suggests that implicit racial prejudice and stereotypes affect perception. For instance, several studies have demonstrated that non-Black participants identify weapons faster and are more likely to identify non-weapons as weapons when the image of the weapon is paired with the image of a Black person (Payne, 2001; Payne, Shimizu, & Jacoby, 2005). Furthermore, White individuals’ decisions to shoot an armed target in a video game is made more quickly when the target is Black (Correll, Park, Judd, & Wittenbrink, 2002; Correll, Urland, & Ito, 2006). This research is important, considering the number of very high-profile cases in the last few decades in which young Blacks were killed by people who claimed to believe that the unarmed individuals were armed and/or represented some threat to their personal safety.
Think It Over
Have you ever listened to a song on the radio and sung along only to find out later that you have been singing the wrong lyrics? Once you found the correct lyrics, did your perception of the song change?
Illusions
Why Illusions?
Psychologists have analyzed perceptual systems for more than a century. Vision and hearing have received the most attention by far, but other perceptual systems, like those for smell taste movement, balance, touch, and pain, have also been studied extensively. Perception scientists use a variety of approaches to study these systems—they design experiments, study neurological patients with damaged brain regions, and create perceptual illusions that toy with the brain’s efforts to interpret the sensory world.
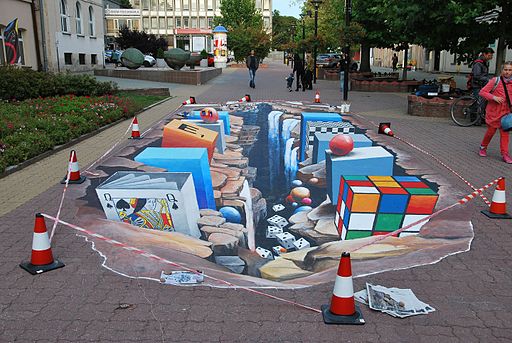
Creation and testing of perceptual illusions has been a fruitful approach to the study of perception—particularly visual perception—since the early days of psychology. People often think that visual illusions are simply amusing tricks that provide us with entertainment. Many illusions are fun to experience, but perception scientists create illusions based on their understanding of the perceptual system. Once they have created a successful illusion, the scientist can explore what people experience, what parts of the brain are involved in interpretation of the illusion, and what variables increase or diminish the strength of the illusion. Scientists are not alone in this interest. Visual artists have discovered and used many illusion-producing principles for centuries, allowing them to create the experience of depth, movement, light and shadow, and relative size on two-dimensional canvases.
Depth Illusions
When we look at the world, we are not very good at detecting the absolute qualities of things—their exact size or color or shape. What we are very good at is judging objects in the context of other objects and conditions. Let’s take a look at a few illusions to see how they are based on insights about our perception. Look at Figure 2 below. Which of the two horizontal yellow lines looks wider, the top one or the bottom one?

Most people experience the top line as wider. They are both exactly the same length. This experience is called the Ponzo illusion. Even though you know that the lines are the same length, it is difficult to see them as identical. Our perceptual system takes the context into account, here using the converging “railroad tracks” to produce an experience of depth. Then, using some impressive mental geometry, our brain adjusts the experienced length of the top line to be consistent with the size it would have if it were that far away: if two lines are the same length on my retina, but different distances from me, the more distant line must be in reality longer. You experience a world that “makes sense” rather than a world that reflects the actual objects in front of you.
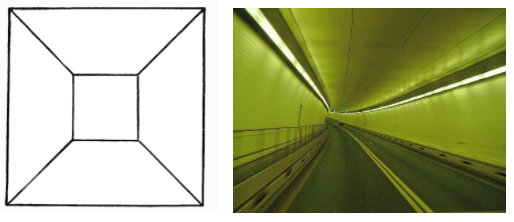
There are many depth illusions. It is difficult to see the drawing on the left below as a two-dimensional figure. The converging lines and smaller square at the center seem to coax our perceptual systems into seeing depth, even though we know that the drawing is flat. This urge to see depth is probably so strong because our ability to use two-dimensional information to infer a three dimensional world is essential for allowing us to operate in the world. The picture on the right below is a driving tunnel, something you would need to process at high speed if you were in a car going through it. Your quick and detailed use of converging lines and other cues allows you to make sense of this 3-D world.
Light and Size Illusions
Depth is not the only quality in the world that shows how we adjust what we experience to fit the surrounding world. Look at the two gray squares in the figure below. Which one looks darker?

Most people experience the square on the right as the darker of the two gray squares. You’ve probably already guessed that the squares are actually identical in shade, but the surrounding area—black on the left and white on the right—influence how our perceptual systems interpret the gray area. In this case, the greater difference in shading between the white surrounding area and the gray square on the right results in the experience of a darker square.
Here is another example below. The two triangular figures are identical in shade, but the triangle on the left looks lighter against the dark background of the cross when compared to the triangle in the white area on the right.

Our visual systems work with more than simple contrast. They also use our knowledge of how the world works to adjust our perceptual experience. Look at the checkerboard below. There are two squares with letters in them, one marked “A” and the other “B”. Which one of those two squares is darker?

This seems like an easy comparison, but the truth is that squares A and B are identical in shade. Our perceptual system adjusts our experience by taking some visual information into account. First, “A” is one of the “dark squares” and “B” is a “light square” if we take the checkerboard pattern into account. Perhaps even more impressive, our visual systems notice that “B” is in a shadow. Object in a shadow appear darker, so our experience is adjusted to take account of effect of the shadow, resulting in perceiving square B as being lighter than square A, which sits in the bright light. And if you really don’t believe your eyes, take a look at a video showing the same color tiles here.
Try It
One final illusion takes us back to adjustment for size. Look at the two sets of circles. Your task is to adjust the center circle on the left so it is the same actual size as the center circle on the right. The surrounding circles will not change in size, though the right of circles will expand to accommodate the size of the center circle. Use the slide bar with the label “Size of left circle” to make your adjustments. When you are satisfied with your adjustment, check your accuracy by clicking on the “Verify Diameter” button. Click “Reset” to try again.
This illusion is called the Ebbinghaus illusion, created by Hermann Ebbinghaus, one of the early founders of experimental psychology.
Here is another example of the Ebbinghaus illusion:

In this version of the illusion, most people see the circle on the right as larger than the one on the left. The two orange circles are exactly the same size. The Ebbinghaus illusion again illustrates the tendency of our perceptual systems to adjust our experience of the world to the surrounding context.
Link to Learning
If you want to explore more visual illusions, visit this website with dozens of interesting illusions created by Michael Bach.
Psych in Real Life: Illusions
Remember the Ebbinghaus illusion (shown again below)? How do you think a psychologist might use this illusion to learn about mental processes or behavior? Read on to see an actual example from a psychologist at Colorado State University.
Try It
Try to match the size of the center orange circle on the left to the size of the center orange circle on the right. Use the slide bar with the label “Size of left circle” to make your adjustments. When you are satisfied with your adjustment, check your accuracy by clicking on the “Verify Diameter” button. Click “Reset” to try again.
Ebbinghaus in the Real World
Imagine that you are in a golf competition in which you are putting against someone with the same experience and skill that you have. There is one problem: Your opponent gets to putt into a hole that is 10% larger than the hole you have to use. You’d probably think that the competition was unfairly biased against you.
Now imagine a somewhat different situation. You and your opponent are about equal in ability and the holes you are using are the same size, but the hole that your opponent is using looks 10% larger than the one you are using. Would your opponent have an unfair advantage now?
If you read the earlier section on the Ebbinghaus effect, you have an idea how psychologists could exploit your perceptual system (and your opponent’s) to test this very question. Psychologist Jessica Witt and her colleagues Sally Linkenauger and Dennis Proffitt recruited research participants with no unusual golf experience to participate in a putting task. They competed against themselves rather than against another person.
The experimenters made the task challenging by using a hole with a 2-inch diameter, which is about half the diameter of the hole you will find on a golf course. An overhead projector mounted on the ceiling of their lab allowed them to project Ebbinghaus’s circles around the putting hole. Some participants saw the putting hole surrounded by circles that were smaller than the hole in the center; the other half saw surrounding black circles that were larger.
Participants putted from about 11½ feet away. They took 10 putts in one condition, and then 10 in the other condition. Half of the participants putted with the large surrounding circles first and half saw the small surrounding circles first. This procedure is called counterbalancing. If there is any advantage (e.g., getting better over time with practice) or disadvantage (e.g., getting tired of putting), counterbalancing assures that both conditions are equally exposed to the positive or negative effects of which task goes first or second. Failure to take account of this type of problem means that you may have a confounding variable—practice or fatigue—that influences performance. A confounding variable is something that could influence performance, but is not part of the study. We try to control (that is, neutralize) potentially confounding variables so they cannot be the cause of performance differences. So, for instance, if everyone did the large surrounding circles condition first and then the small surrounding circles, then differences in performance could be due to order of conditions (leading to practice or fatigue effects) rather than the size of the surrounding circles. By counterbalancing, we don’t get rid of the effects of practice or fatigue for any particular person, but—across all the participants—practice or fatigue should affect both conditions (both types of Ebbinghaus circles) equally.
The experimenters wanted to know two things. First, did they actually produce the Ebbinghaus illusion? Remember: there is no guarantee that people see or think the way your theory says they should. So just before the participant started putting in a particular condition, he or she drew a circle using a computerized drawing tool, attempting to match the exact size of the putting hole. This is better than simply asking, “do you see the illusion?” The drawing task attempts to directly measure what they perceive.
Second, the experimenters wanted to see if the perceived size of the hole influenced putting accuracy. They recorded the success or failure of each putt. Each participant could get a score of 0 to 10 successful putts in each condition.
Methods Summary
Recap the steps you’ve read about thus far:
- The participant practices putting to get used to the task.
- The participant completes the first condition (large surrounding circles for half of the participants and small surrounding circles for the other half).
- The participant draws a circle corresponding to his or her estimation of the actual size of the putting hole. This allows the experimenters to determine if the Ebbinghaus effect actually occurred.
- The participant putts 10 times in this condition.
- Participant completes the second condition (whichever condition they have not yet done).
- The participant draws a circle corresponding to his or her estimation of the actual size of the putting hole.
- The participant putts 10 times in this condition.
Try It
Now that you know the details of Jessica Witt’s experiment, see if you can answer the following questions. Decide which option you think is correct and then click the ‘Show Answer’ link to see if you’re right.
Question 1: What is the independent variable as described in this study?
a. The size of the putting hole is the independent variable.
b. The size of the circles surrounding the putting hole is the independent variable.
c. The distance the person had to putt is the independent variable.
d. There are two independent variables: the size of the putting hole and the size of the surrounding circles.
Show Answer
An INDEPENDENT VARIABLE is something intentionally manipulated (changed) by the experimenter. To test the effect of the Ebbinghaus illusion, the experimenters had participants putt into holes surrounded by larger circles and smaller circles. This “manipulation” of the size of the surrounding holes is the independent variable.
Question 2: What is the dependent variable in this study?
a. The number of successful putts is the dependent variable.
b. The size of the circle drawn by the participant is the dependent variable.
c. The size of the putting hole is the dependent variable.
d. There are two dependent variables: the number of successful putts and the size of the circle drawn by the participants are both dependent variables.
Show Answer
A DEPENDENT VARIABLE is some behavior or thought process measured by the experimenter. This study had two dependent variables:
- (a) the size of the circle drawn by the participant
- (b) the number of successful putts
Both dependent variables were measured for each condition, so each participant drew 2 circles and had 0 to 10 successful putts in both the large surrounding circles condition and the small surrounding circles condition.
Now see if you can guess the results of this study.
Try It
Question 3: How did the participants perceive the holes?
Resize the bars by clicking and dragging them to show your predicted results when the subjects were asked to draw the circles. Make a general prediction based on your understanding of the experiment.
Show Answer
This question tested whether or not the Ebbinghaus effect was produced in this experiment. If there is no difference between the bars, that would mean that participants didn’t experience the Ebbinghaus illusion. The exact height of the bars is not important here, but the relative heights should look something like this:

The taller bar on the right means that the center putting hole looks larger when it is surrounded by smaller circles than when the same hole is surrounded by large circles (the Ebbinghaus illusion!).
This result was important because the reasoning behind the experiment was dependent on successfully producing the Ebbinghaus illusion. There is a technical term for a dependent variable that is used to determine if your independent variable is actually working: a manipulation check. Good experimenters use manipulation checks to be sure they aren’t fooling themselves into believing that they have done something that really didn’t work.
Question 4: Can you guess how well the participants putted?
Resize the bars by clicking and dragging them to show your predicted results when the subjects putted.
Show Answer
This question lets you check out your skills as a psychologist. The description of the experiment did not include the researchers’ hypothesis, so you have to decide for yourself what you think is going to happen. The three possible patterns of results are shown below. The graph you drew fit one of these patterns.

Try It
Do you think the illusion affected putting performance? Why or why not?
Show Answer
Until now, we haven’t told you exactly how the Ebbinghaus illusion was predicted to influence putting—only that the experimenters thought it would have some sort of influence. So here is what they said.
The experimenters thought that the perceived size of the hole would affect the SELF-CONFIDENCE of the person as he or she putted. If you are putting into a larger hole (or what is PERCEIVED as a larger hole) you should be more confident that you will sink your putt. Remember, this is just a prediction based on the experimenters’ reasoning. Their ideas came from interviewing skilled athletes who claimed that objects seemed larger and time seemed to slow down as they gained skill. If the ball you have to catch is bigger or the person blocking you is slower, you can perform at a higher level.
The experimenters could be right or they could be wrong. Your own reasoning might be different than that of the experimenters. For instance, perhaps you thought that people would be MORE CAREFUL if they thought the hole was smaller. That would be a perfectly fine hypothesis. Interestingly, it makes the opposite prediction from the experimenters’ self-confidence hypothesis. This “careful putting with smaller holes” theory predicts that people should putt better when they perceive the hole as smaller (i.e., when the surrounding circles are large). The experimenters’ “more confidence with larger holes” hypothesis predicts that people should putt better when they perceive the hole as larger.
Here are the actual results. First, the hole was perceived as larger when it was surrounded by smaller holes, so there is evidence that they successfully produced the Ebbinghaus illusion. Second, the experimenters predicted that participants would be more successful when the hole seemed larger (i.e., surrounded by smaller circles). Consistent with these predictions, the results looked like this:

This is not the only experiment that has used a sports context to study the effects of illusions. Other experiments have shown that people hit softballs better when the balls are perceived as larger. People score higher in darts when the board appears larger. Athletes kick field goals and return tennis balls more successfully when the goal posts or tennis balls appear larger. In all of these studies, the balls or boards or goal posts were not actually larger, but they were perceived as larger because the experimenters created illusions. Skilled athletes often report that targets appear larger or time slows down when they are “in the zone”, as if practice and skill create their own perceptual illusions that increase confidence and make difficult challenges feel easier.
Link to Learning
Watch this interview with Psychologist Jessica Witt to see her talk about how her research utilizing the Ebbinghaus illusion impacts a golfer’s perception and performance. You can also read about more about similar variations of her research here.
You can view the transcript for “A hole in the head: Golf and Perception” here (opens in new window).
A Final Note: Science Doesn’t Always Produce Simple Results
Professor Witt’s study had interesting results; however, they weren’t quite as simple as we have made them seem. The researchers actually had two different hole sizes: 2 inches and 4 inches. The Ebbinghaus circles were adjusted to be relatively larger or smaller than the putting hole.
The Ebbinghaus illusion worked for the smaller (2 inch) putting holes, but not for the larger (4 inch) putting holes. In other words, when people drew the circles as they perceived them (the “manipulation check” dependent variable), they drew different sized circles for the 2 inch holes (the Ebbinghaus illusion), but the same size circles for the 4 inch holes (no Ebbinghaus illusion).
For the larger (4 inch) putting holes, putting accuracy was the same for the two different conditions. This didn’t bother the experimenters, because—as we have already noted—the participants did not experience the Ebbinghaus illusion with the larger holes. If the holes were perceived as the same, then self-confidence should not have been affected and, in turn, putting should not have been better in one condition than the other.
In the research paper, the experimenters suggest a few technical reasons that the larger hole might not have produced the Ebbinghaus illusion, but they admit that they have no definitive explanation. That’s okay. Science often yields messy results—and these can be the basis for new experiments and sometimes for really interesting discoveries. The world is not as simple as our theories try to make it seem. Happily, in science, as in many aspects of life, you learn more from your failures than your successes, so good scientists don’t try to hide from results they don’t expect.
Licenses and Attributions (Click to expand)
CC licensed content, Original
- Modification, adaptation, and original content. Provided by: Lumen Learning. License: CC BY: Attribution
- Ebbinghaus Application. Authored by: Patrick J Carroll. Provided by: Lumen Learning. License: CC BY: Attribution
CC licensed content, Shared previously
- Perception Poster Show Concept. Authored by: Jon Ashcroft. Located at: https://www.flickr.com/photos/theilluminated/5704563713. License: CC BY: Attribution
- Gestalt Principles of Psychology. Authored by: OpenStax College. Located at: https://openstax.org/books/psychology-2e/pages/5-6-gestalt-principles-of-perception. License: CC BY: Attribution. License Terms: Download for free at https://openstax.org/books/psychology-2e/pages/1-introduction
- Contrast Illusion. Authored by: Paaliaq. Provided by: Wikimedia. Located at: https://commons.wikimedia.org/wiki/Category:Contrast_illusions#/media/File:Simultaneous_Contrast.jpg. License: CC BY-SA: Attribution-ShareAlike
- Benary Cross Illusion. Provided by: Wikimedia. Located at: https://commons.wikimedia.org/wiki/Category:Contrast_illusions#/media/File:Benary_Cross.svg. License: Public Domain: No Known Copyright
- Horizontal 3D grafitti. Provided by: Wikimedia. Located at: https://commons.wikimedia.org/wiki/File:Horizontal_3d_graffiti,_%C5%81%C3%B3d%C5%BA_Schillera_Passage.jpg. License: CC BY-SA: Attribution-ShareAlike
- Illusions Explanation. Authored by: Patrick Carroll. Provided by: Lumen Learning. License: CC BY: Attribution
- Mond-Vergleich image. Authored by: Fibonacci. Located at: https://commons.wikimedia.org/wiki/File:Mond-vergleich.svg. Project: Wikimedia. License: CC BY-SA: Attribution-ShareAlike
- A hole in the head: Golf and Perception. Authored by: sciencentral. Located at: https://www.youtube.com/watch?v=XDNfTUOSjFw. License: Other. License Terms: Standard YouTube License
- golf picture. Authored by: coffee. Provided by: Pixabay. Located at: https://pixabay.com/en/ball-golf-golf-ball-golf-course-1842170/. License: CC0: No Rights Reserved
All rights reserved content
- Perceiving is Believing – Crash Course Psychology #7. Provided by: CrashCourse. Located at: https://www.youtube.com/watch?v=n46umYA_4dM. License: Other. License Terms: Standard YouTube License
Public domain content
- Ponzo Illusion. Provided by: Wikipedia. Located at: https://commons.wikimedia.org/wiki/File:Ponzo_illusion.gif. License: Public Domain: No Known Copyright
- Baltimore Harbor Tunnel. Authored by: ErgoSum88. Provided by: Wikimedia. Located at: https://commons.wikimedia.org/wiki/Category:Centered_tunnel_perspective#/media/File:Baltimore_Harbor_Tunnel_I-895_02.JPG. License: Public Domain: No Known Copyright
- Simple shape square optical illusion. Provided by: Wikimedia. Located at: https://commons.wikimedia.org/wiki/Category:Optical_illusions#/media/File:PSM_V54_D322_Simple_shape_creating_optical_illusion_2.png. License: Public Domain: No Known Copyright
- Checkerboard Illusion. Authored by: Adrian Pingstone . Provided by: Wikipedia. Located at: https://commons.wikimedia.org/wiki/File:Optical.greysquares.arp.jpg. License: Public Domain: No Known Copyright
- Ebbinghaus Illusion. Provided by: Wikimedia. Located at: https://en.wikipedia.org/wiki/File:Mond-vergleich.svg. License: Public Domain: No Known Copyright
field of psychology based on the idea that the whole is different from the sum of its parts
segmenting our visual world into figure and ground
things that are close to one another tend to be grouped together
things that are alike tend to be grouped together
(also, continuity) we are more likely to perceive continuous, smooth flowing lines rather than jagged, broken lines
organizing our perceptions into complete objects rather than as a series of parts
organize perceptions into complete objects rather than as a series of parts
ability to discriminate among different figures and shapes
educated guess used to interpret sensory information
