1.4: Library of functions; piecewise-defined functions
Learning Objectives
- Identify parent functions.
- Find the domain of a function.
- Evaluate a piecewise-defined function.
- Graph a piecewise-defined function.
Identify parent functions and its domain
| Function | Graphs | Properties |
|---|---|---|
| Constant Function
[latex]f\left(x\right)=c[/latex] |
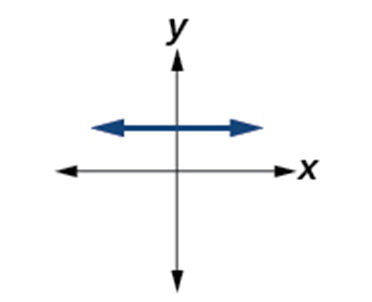 |
Even Function
Neither increasing nor decreasing, constant function. Domain: [latex]\left(-\infty,\;\infty\right)[/latex] |
| Identity Function
[latex]f\left(x\right)=x[/latex] |
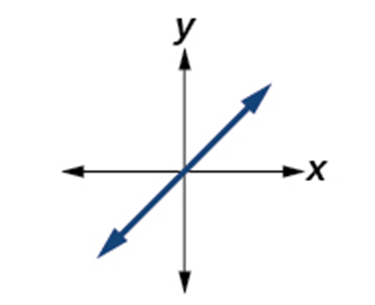 |
Odd Function.
Increasing function. Domain: [latex]\left(-\infty,\;\infty\right)[/latex] |
| Quadratic Function
[latex]f\left(x\right)=x^2[/latex] |
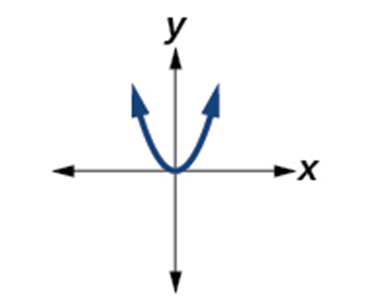 |
Even Function
Increasing on [latex]\left(0,\;\infty\right)[/latex] Decreasing on [latex]\left(-\infty,\;0\right)[/latex] Minimum at [latex]x=0[/latex] Domain: [latex]\left(-\infty,\;\infty\right)[/latex] |
| Cubic Function
[latex]f\left(x\right)=x^3[/latex] |
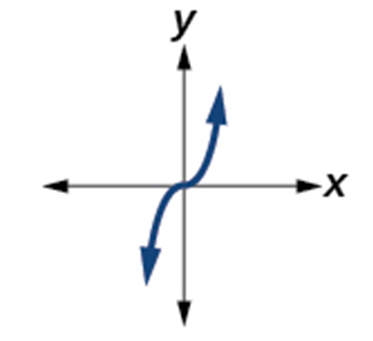 |
Odd Function.
Increasing function. Domain: [latex]\left(-\infty,\;\infty\right)[/latex] |
| Reciprocal Function
[latex]f\left(x\right)=\frac1x[/latex] |
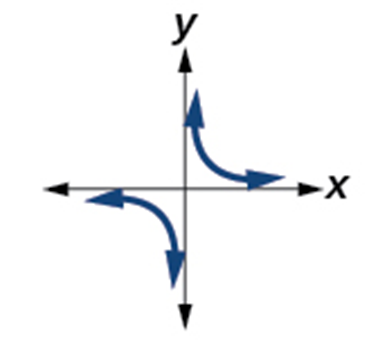 |
Odd Function.
Decreasing on [latex]\left(-\infty,\;0\right)\cup\left(0,\;\infty\right)[/latex] Domain: [latex]\left(-\infty,\;0\right)\cup\left(0,\;\infty\right)[/latex] |
| Reciprocal Squared
[latex]f\left(x\right)=\frac1{x^2}[/latex] |
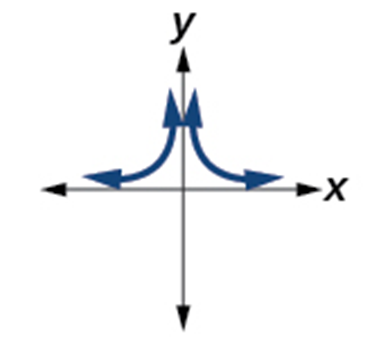 |
Even Function
Increasing on [latex]\left(-\infty,\;0\right)[/latex] Decreasing on [latex]\left(0,\;\infty\right)[/latex] Domain: [latex]\left(-\infty,\;0\right)\cup\left(0,\;\infty\right)[/latex] |
| Cube Root
[latex]f\left(x\right)=\sqrt[3]x[/latex] |
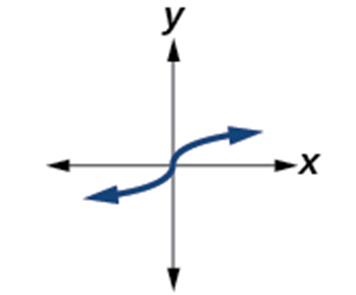 |
Odd Function.
Increasing function. Domain: [latex]\left(-\infty,\;\infty\right)[/latex] |
| Square Root
[latex]f\left(x\right)=\sqrt x[/latex] |
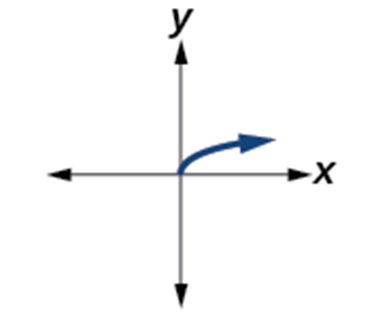 |
Increasing on [latex]\left(0,\;\infty\right)[/latex]
Domain: [latex]\lbrack0,\;\infty)[/latex] It is neither. (not even, not odd) |
| Absolute Value
[latex]f\left(x\right)=\left|x\right|[/latex] |
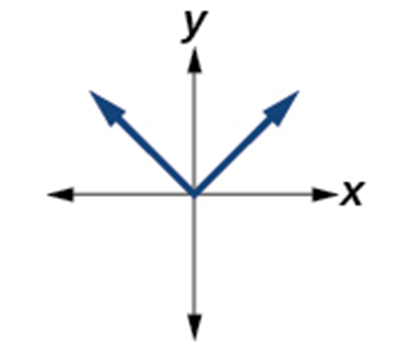 |
Even Function
Increasing on [latex]\left(0,\;\infty\right)[/latex] Decreasing on [latex]\left(-\infty,\;0\right)[/latex] Domain: [latex]\left(-\infty,\;\infty\right)[/latex] |
Piecewise-defined function
Definition: A piecewise function is a function in which more than one formula is used to define the output over different pieces of the domain.
It is a function in which more than one formula is used to define the output. Each formula has its own domain, and the domain of the function is the union of all these smaller domains. We notate this idea like this:
[latex]f\left(x\right)=\left\{\begin{array}{lc}formula\;1&if\;x\;is\;in\;domain\;1\\formula\;2&if\;x\;is\;in\;domain\;2\\formula\;3&if\;x\;is\;in\;domain\;3\end{array}\right.[/latex]
In piecewise notation, the absolute value function is
[latex]\left|x\right|=\left\{\begin{array}{lc}x&if\;x\;\geq\;0\\-x&if\;x\;<\;0\end{array}\right.[/latex]
How to evaluate a piecewise-defined function
Given a piecewise function, write the formula and identify the domain for each interval.
- Identify the intervals for which different rules apply.
- Determine formulas that describe how to calculate an output from an input in each interval.
- Use braces and if-statements to write the function.
 Your Turn
Practice 1.4-3-1
Practice 1.4-3-2
Graph a piecewise-defined function
Given a piecewise function, sketch a graph.
- Indicate on the x-axis the boundaries defined by the intervals on each piece of the domain.
- For each piece of the domain, graph on that interval using the corresponding equation pertaining to that piece. Do not graph two functions over one interval because it would violate the criteria of a function.
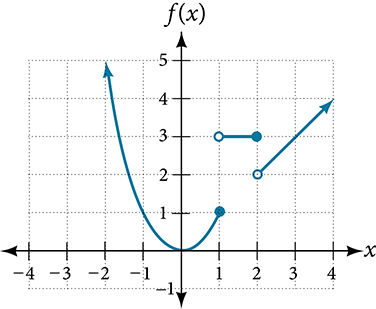
Example 1.4-4-1: Graphing a Piecewise Function. Sketch a graph of the function.
 Key
Key
Example 1.4-4-1: Graphing a Piecewise Function. Sketch a graph of the function.
Each of the component functions is from our library of toolkit functions, so we know their shapes. We can imagine graphing each function and then limiting the graph to the indicated domain. At the endpoints of the domain, we draw open circles to indicate where the endpoint is not included because of a less-than or greater-than inequality; we draw a closed circle where the endpoint is included because of a less-than-or-equal-to or greater-than-or-equal-to inequality.
Figure shows the three components of the piecewise function graphed on separate coordinate systems.

- [latex]f\left(x\right)=x^2\;if\;x\leq1;[/latex]
- [latex]f\left(x\right)=3\;if\;1< x\leq2;[/latex]
- [latex]f\left(x\right)=x\;if\;x>2[/latex]
Now that we have sketched each piece individually, we combine them in the same coordinate plane. See
 Analysis
Note that the graph does pass the vertical line test even at [latex]x=1[/latex] and [latex]x=2[/latex] because the points [latex](1, 3)[/latex] and [latex](2, 2)[/latex] are not part of the graph of the function, though [latex](1, 1)[/latex] and [latex](2, 3)[/latex] are.
 Your Turn
Practice 1.4-4-1
Licenses and Attribution
CC Licensed Content
- College-algebra-2e by Jay Abramson is licensed CC BY. Access for free.

