
2.2: Properties of Quadratic Functions
Learning Objectives
- Find key points on the graph of a quadratic function, including the vertex, intercepts, and minimum/maximum value.
- Graph a quadratic function.
Graph a quadratic function
A quadratic equation has
Standard form [latex]ax^2+bx+c=0[/latex], where [latex]a, b,[/latex] and [latex]c[/latex] are real numbers and [latex]a\neq0[/latex].
Vertex form [latex]a\left(x-h\right)^2+k=0[/latex], where [latex]a[/latex] is real numbers and [latex]a\neq0[/latex].
The graph of a quadratic function is a U-shaped curve called a parabola. One important feature of the graph is that it has an extreme point, called the vertex. If the parabola opens up, the vertex represents the lowest point on the graph, or the minimum value of the quadratic function. If the parabola opens down, the vertex represents the highest point on the graph, or the maximum value. In either case, the vertex is a turning point on the graph. The graph is also symmetric with a vertical line drawn through the vertex, called the axis of symmetry.
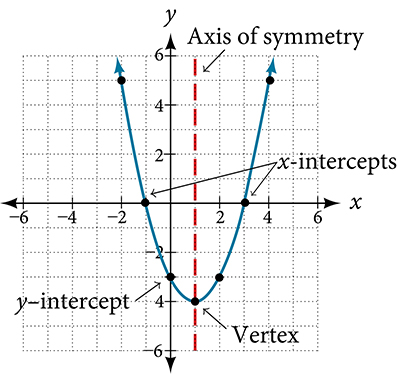
Example 2.2-1-1: Find information on the graph.
|
 |
 Key
Key
Example 2.2-1-1: Find information on the graph.
a is positive, since the graph opens up.
(-3,0) and (-1,0) x-intercept means cross or touch the x-axis, thus y must be 0. |
 |
- What is the y-intercept?
(0,3)
y-intercept means cross or touch the y-axis, thus x must be 0.
- What is the axis of symmetry?
X= - 2
It can be found at the extreme point. It must be an equation, since it is a vertical line.
- Where is the vertex?
(-2,-1)
Extreme point on the graph.
- Does it have a minimum or maximum? What is the value?
It has a minimum, and it is -1.
The minimum /maximum value is the y value at the vertex.
 Your Turn
Practice 2.2-1-1
Graph a quadratic function
Steps to Graph a Quadratic Function
- Find the x-intercepts (if possible):
Set the quadratic equation equal to zero and solve for [latex]x[/latex]. These are the points where the graph crosses the x-axis. - Find the y-intercept:
Substitute [latex]x=0[/latex] into the equation to find the y-intercept. This is where the graph crosses the y-axis. - Find the vertex:
Use the formula [latex]x=\frac{-b}{2a}[/latex] to find the x-coordinate of the vertex. Then substitute this value into the equation to find the corresponding y-coordinate. - Plot the key points:
Plot the x-intercepts, y-intercept, and the vertex on the coordinate plane. - Identify the axis of symmetry:
Draw a vertical dashed line through the vertex. This line is the axis of symmetry and helps ensure the graph is balanced. - If needed, find additional points:
If you cannot find the x- or y-intercepts, or if you need more detail for accuracy, choose one or two additional x-values that haven’t been used, substitute them into the equation, and plot those points. - Sketch the parabola:
Connect all the plotted points smoothly in a U-shaped curve. Extend the curve on both sides, following the general shape and direction of a parabola (opening upward or downward based on the sign of [latex]a[/latex]).
Example 2.2-2-1: Graph
[latex]f\left(x\right)=x^2-2x-15[/latex]
Key
Example 2.2-2-1: Graph
[latex]f\left(x\right)=x^2-2x-15[/latex]
- Find the x-intercepts (if possible):
Set the quadratic equation equal to zero and solve for [latex]x[/latex]. These are the points where the graph crosses the x-axis.
[latex]x^2-2x-15=0[/latex]
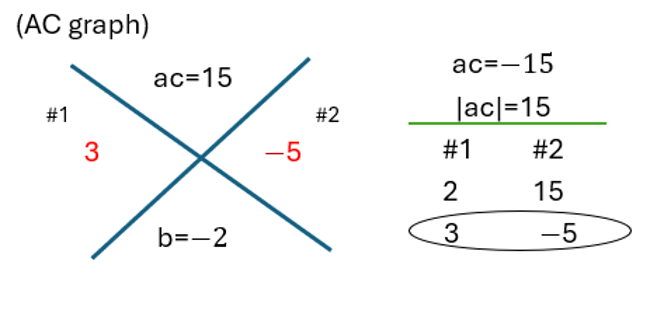
[latex]\left(x+3\right)\left(x-5\right)=0[/latex]
|
[latex]x+3=0[/latex] [latex]x_1=-3[/latex] |
[latex]x-5=0[/latex] [latex]x_2=5[/latex] |
x-intercepts [latex]\left(-3,\;0\right),\;\left(5,\;0\right)[/latex]
- Find the y-intercept:
Substitute [latex]x=0[/latex] into the equation to find the y-intercept. This is where the graph crosses the y-axis.
[latex]f\left(0\right)=\left(0\right)^2-2\left(0\right)-15=-15[/latex]
y-intercept [latex]\left(0,\;-15\right)[/latex]
- Find the vertex:
Use the formula [latex]x=\frac{-b}{2a}[/latex] to find the x-coordinate of the vertex. Then substitute this value into the equation to find the corresponding y-coordinate.
[latex]x=\frac{-\left(-2\right)}{2\left(1\right)}=1[/latex]
[latex]y=f\left(1\right)=\left(1\right)^2-2\left(1\right)-15=-16[/latex]
Vertex [latex]\left(1,\;-16\right)[/latex]
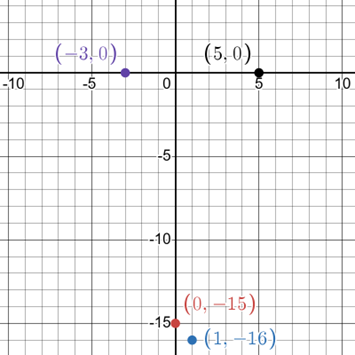
- Plot the key points:
Plot the x-intercepts, y-intercept, and the vertex on the coordinate plane.
- Identify the axis of symmetry:
Draw a vertical dashed line through the vertex. This line is the axis of symmetry and helps ensure the graph is balanced.
[latex]x=1[/latex]
- If needed, find additional points:
If you cannot find the x- or y-intercepts, or if you need more detail for accuracy, choose one or two additional x-values that haven’t been used, substitute them into the equation, and plot those points.
We have all the points:
x-intercepts [latex]\left(-3,\;0\right),\;\left(5,\;0\right)[/latex]
y-intercept [latex]\left(0,\;-15\right)[/latex]
Vertex [latex]\left(1,\;-16\right)[/latex]
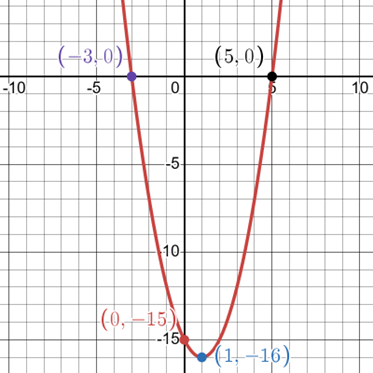
- Sketch the parabola:
Connect all the plotted points smoothly in a U-shaped curve. Extend the curve on both sides, following the general shape and direction of a parabola (opening upward or downward based on the sign of [latex]a[/latex]).
Your Turn
Practice 2.2-2-1
- Read the question carefully. Solve it using paper and pen.
- When you are ready, select the answer arrow to reveal the correct answer and check your work.
- If your answer is incorrect, try solving it again.
- This process will help you practice and improve your skills.

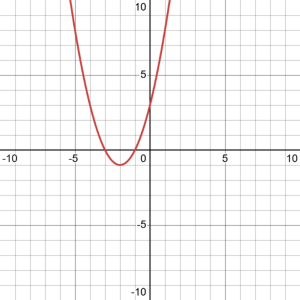
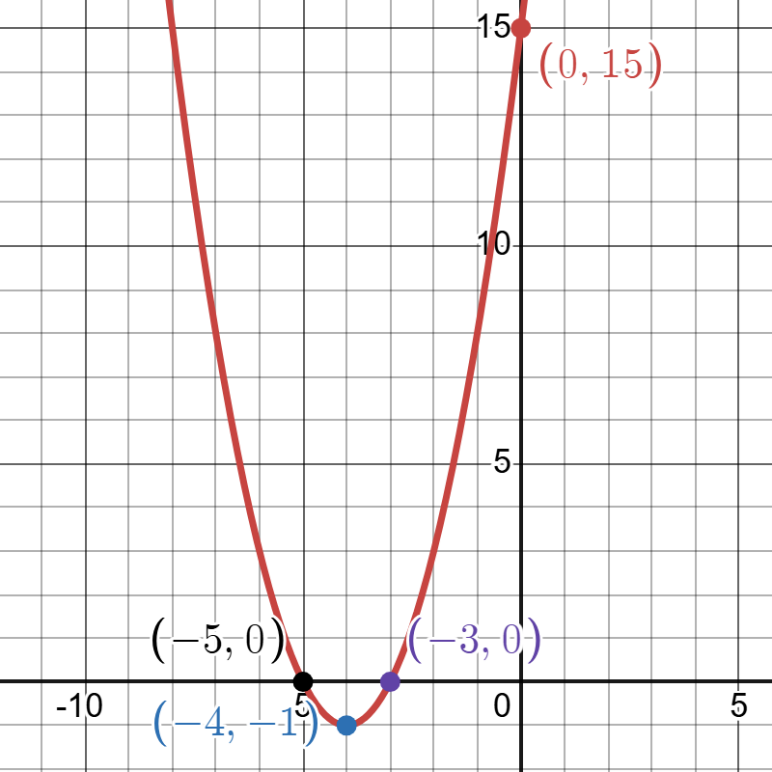
Graph [latex]f\left(x\right)=x^2+8x+15[/latex]
Answer
Licenses and Attribution
CC Licensed Content
- Precalculus-2e by Jay Abramson is licensed CC BY. Access for free.
