
1.2: The graph of a function
Learning Objectives
- Determine when a graph is a function.
- Identify information from or about a graph (Domain and Range).
- Find the zeros or intercepts from or about a function and its graph.
Determine when a graph is a function
The vertical line test can be used to determine whether a graph represents a function. If we can draw any vertical line that intersects a graph more than once, then the graph does not define a function because a function has only one output value for each input value.
Steps:

Given a graph, use the vertical line test to determine if the graph represents a function.
- Inspect the graph to see if any vertical line drawn would intersect the curve more than once.
- If there is any such line, determine that the graph does not represent a function.
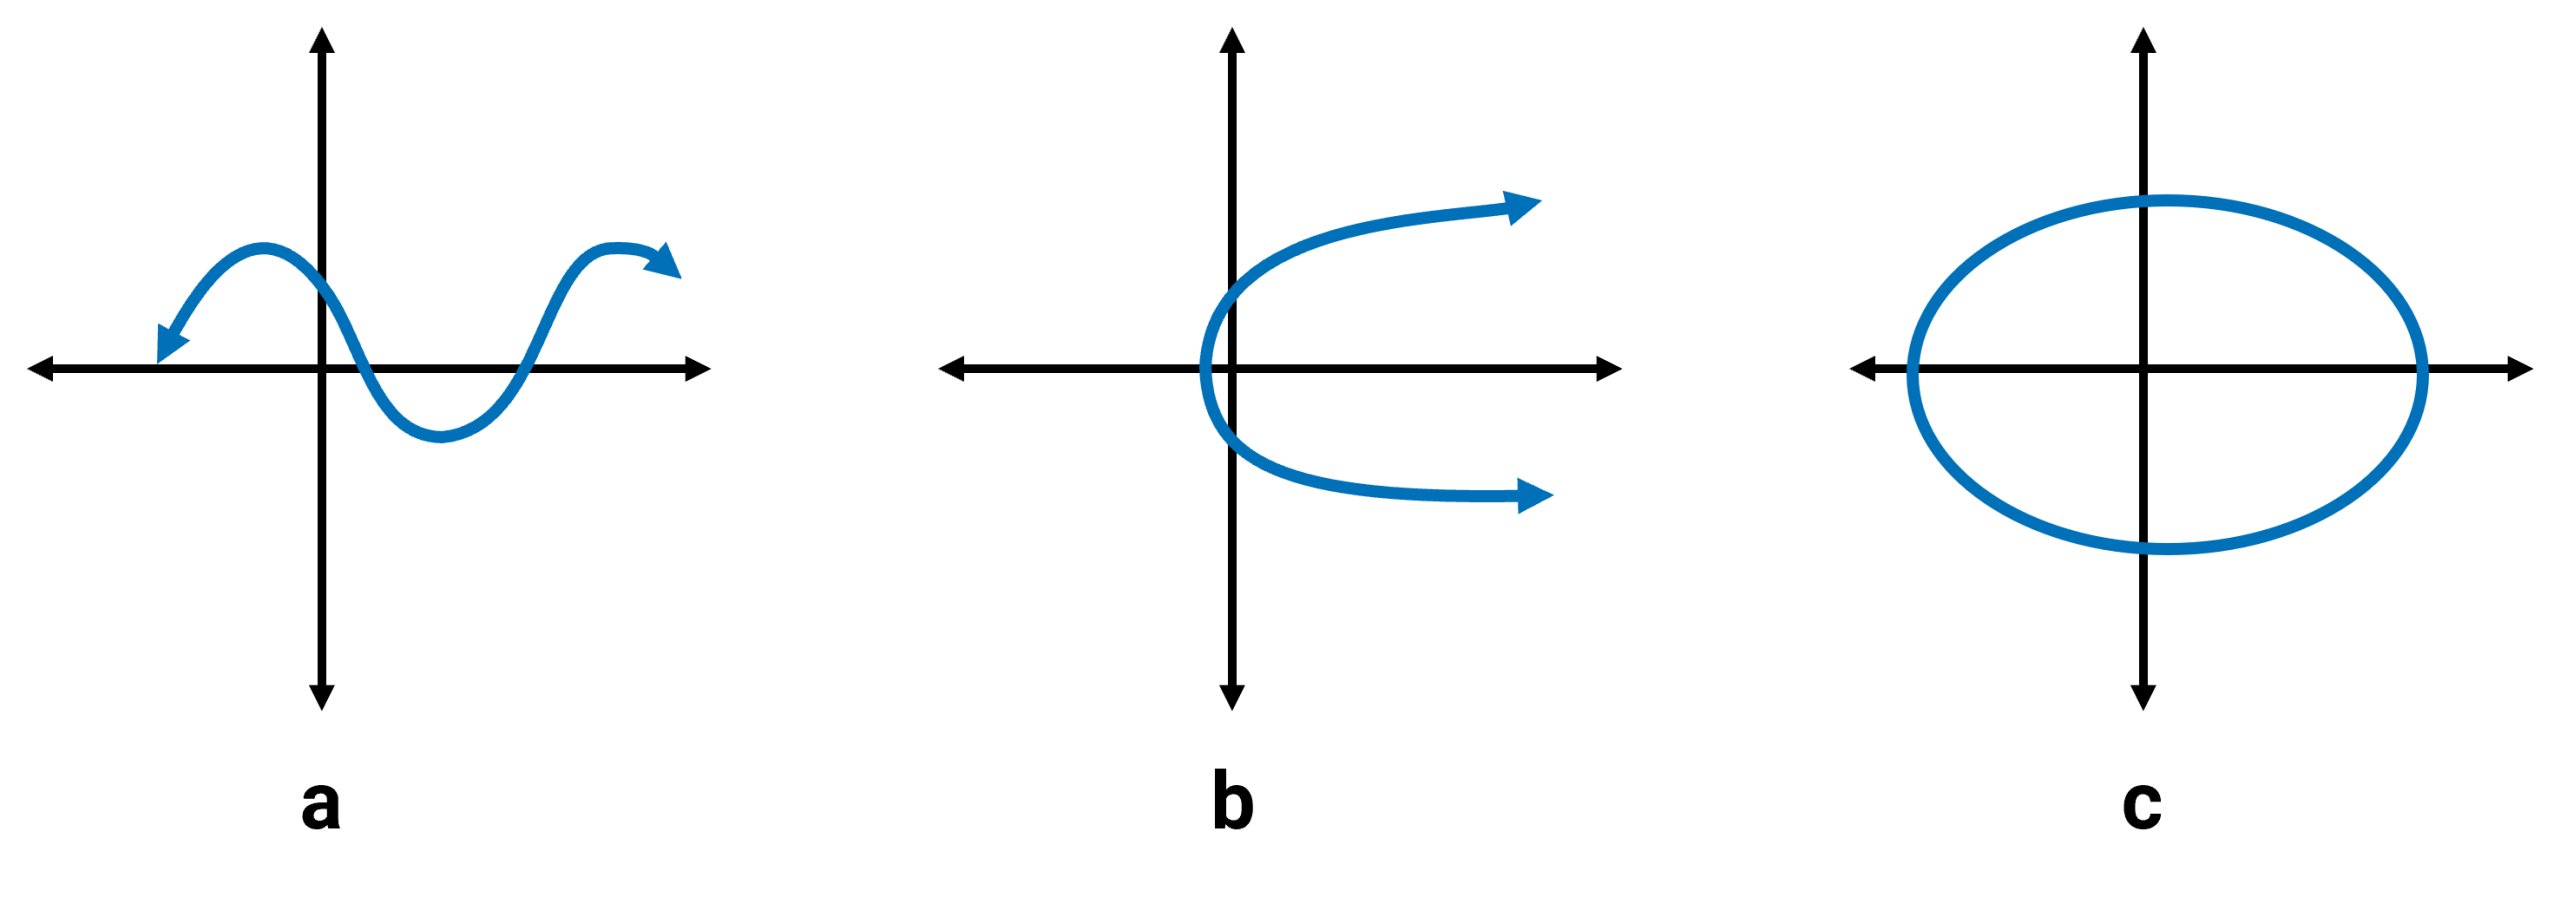
Example 1.2-1-1: Determine if it’s a function.
 Key
Key
Example 1.2-1-1:
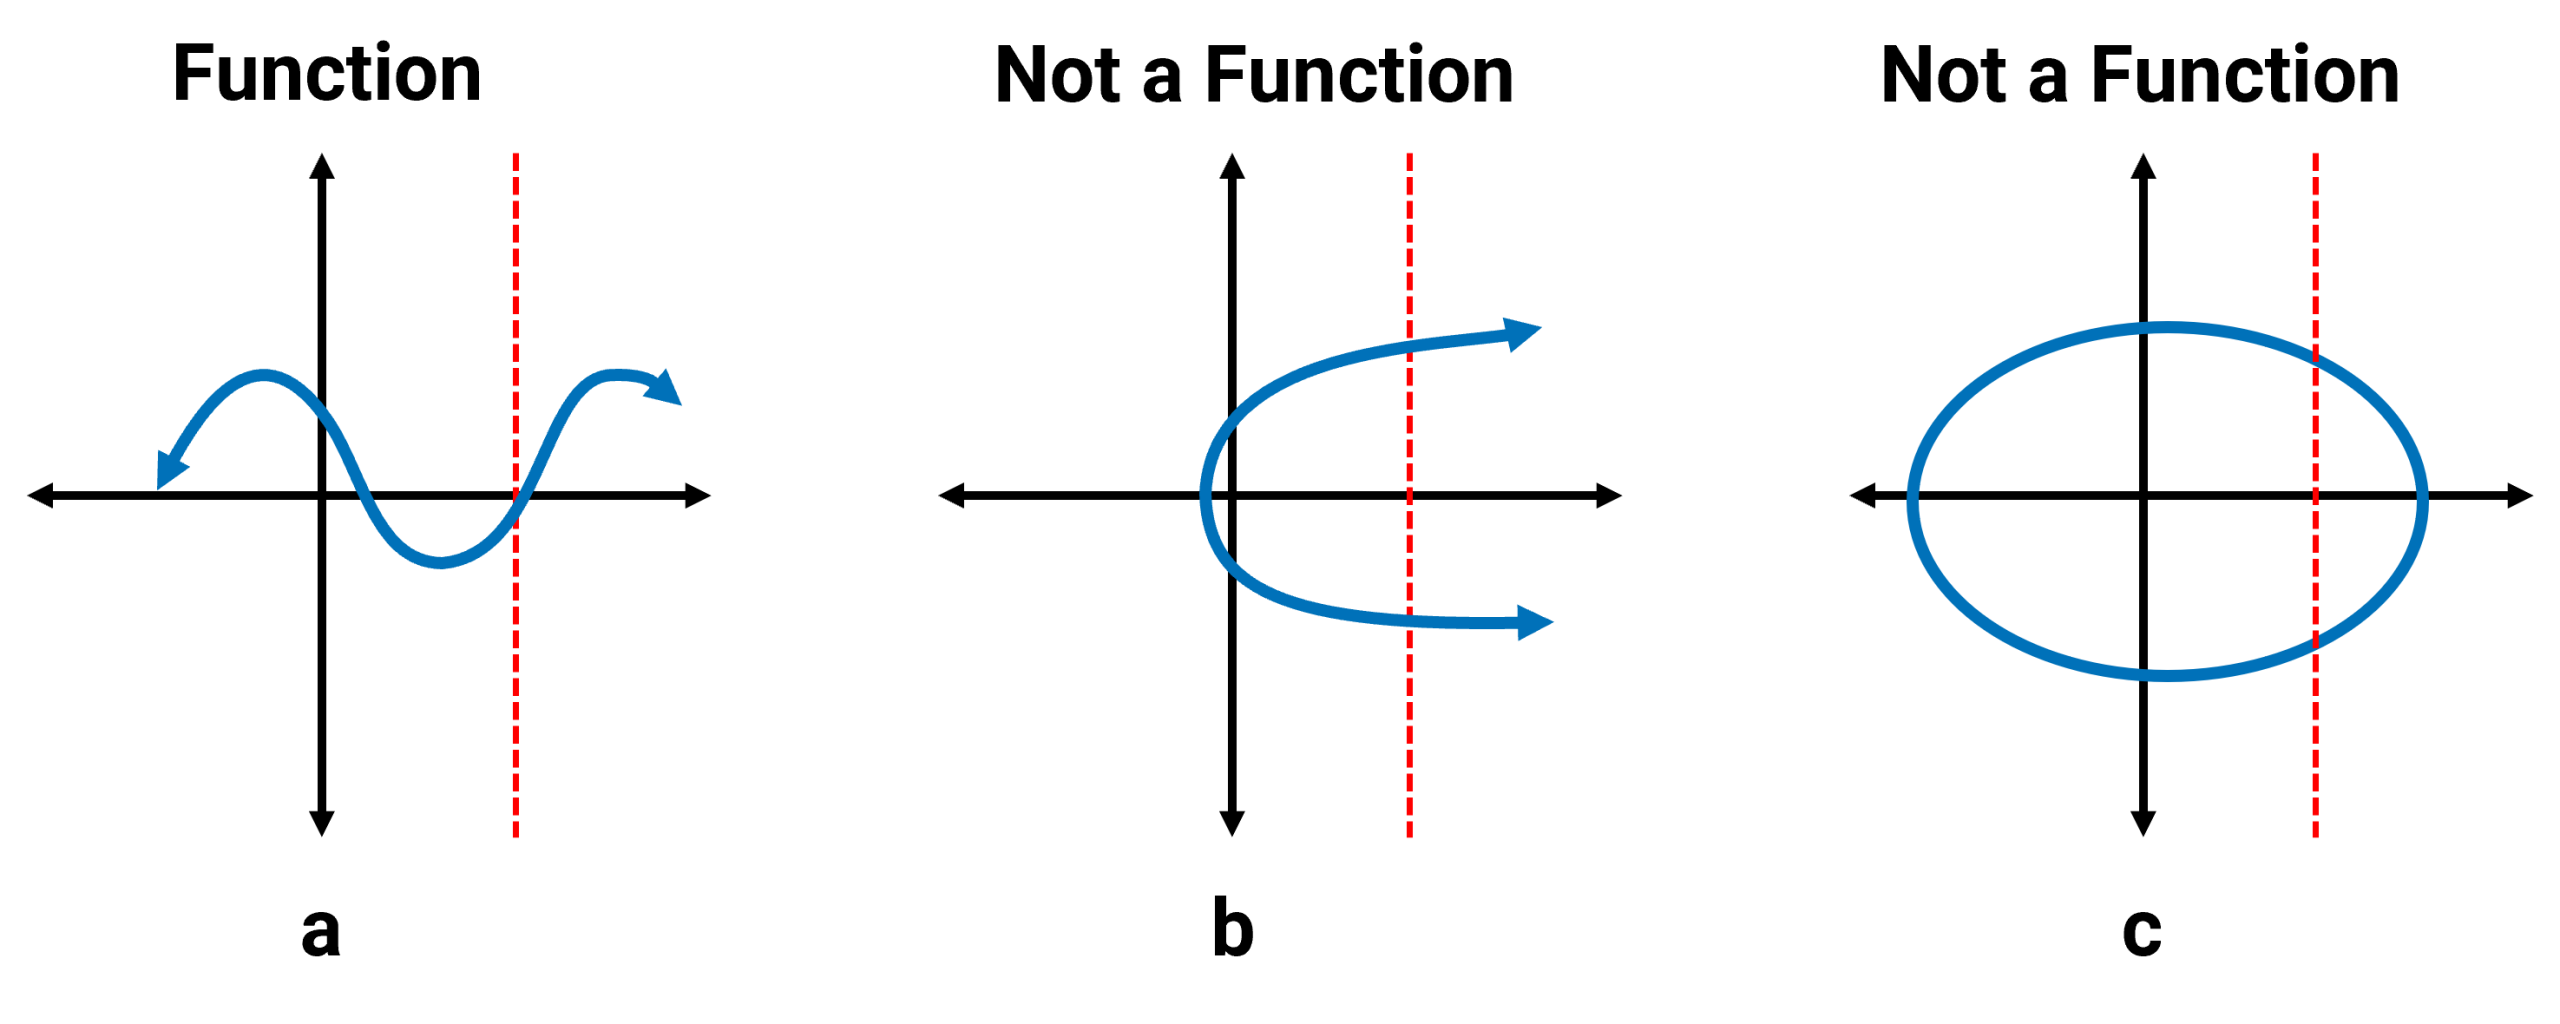
Graph a is a function because, when you move a vertical line across the graph, you see only one intersection point at every position. This means it passes the vertical line test.
Graphs b and graph c are not functions because there are points where the vertical line intersects the graph more than once.
Note: Even though there may be points where the graph intersects the vertical line only once, a graph is considered a function only if the entire graph passes the vertical line test — not just at a single point. Again, the whole graph must pass the test.
 Your Turn
Practice 1.2-1-1
Identify information from or about a graph (Domain and Range)
The domain refers to the set of possible input values, the domain of a graph consists of all the input values shown on the x-axis. The range is the set of possible output values, which are all the output values shown on the y-axis.
Keep in mind that if the graph continues beyond the portion of the graph we can see, the domain and range may be greater than the visible values.
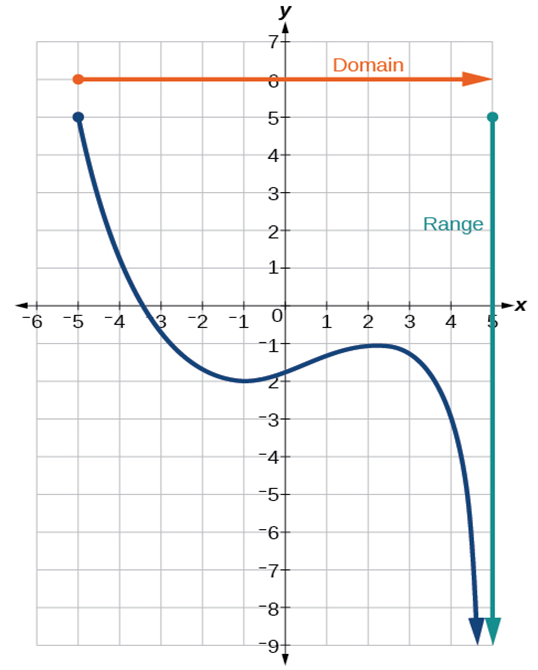

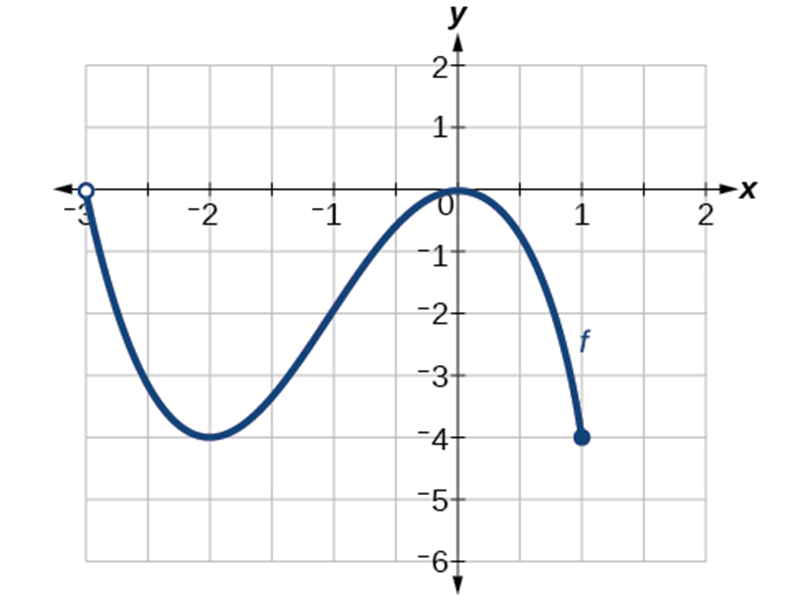
Example 1.2-2-1: Find the domain and range of the function 𝑓 whose graph is shown.
Key
Example 2-2-1:
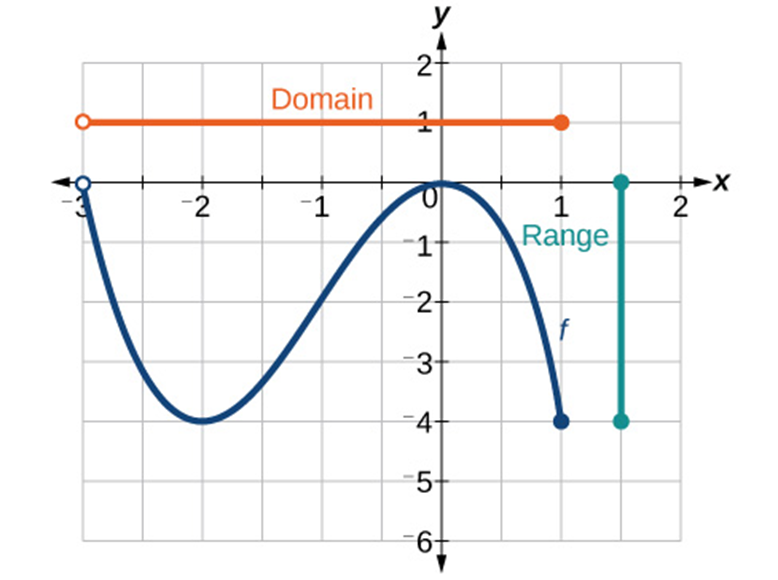
The horizontal extent of the graph is –3 to 1, so the domain of 𝑓 is (−3,1]. The vertical extent of the graph is 0 to –4, so the range is [−4,0].
Your Turn
Practice 1.2-2-1
Practice 1.2-2-2
Practice 1.2-2-3
Practice 1.2-2-4
Find the zeros or intercepts from or about a function and its graph
x-intercept
The point on the graph of a function when the output value is 0; the point at which the graph crosses the horizontal axis.
y-intercept
The value of a function when the input value is zero; also known as initial value.
Example 1.2-3-1: Find the x-intercept(s) and y-intercept.
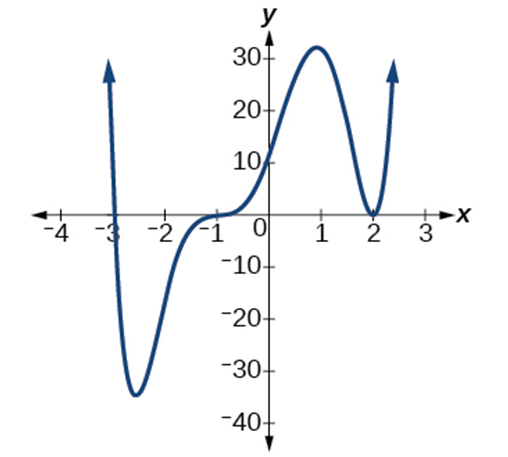
x-intercepts: -3,-1,2 at (-3,0),(-1,0),(2,0).
y-intercepts: 10 at (0,10).
Recall the formatting of Coordinates/Ordered Pair:
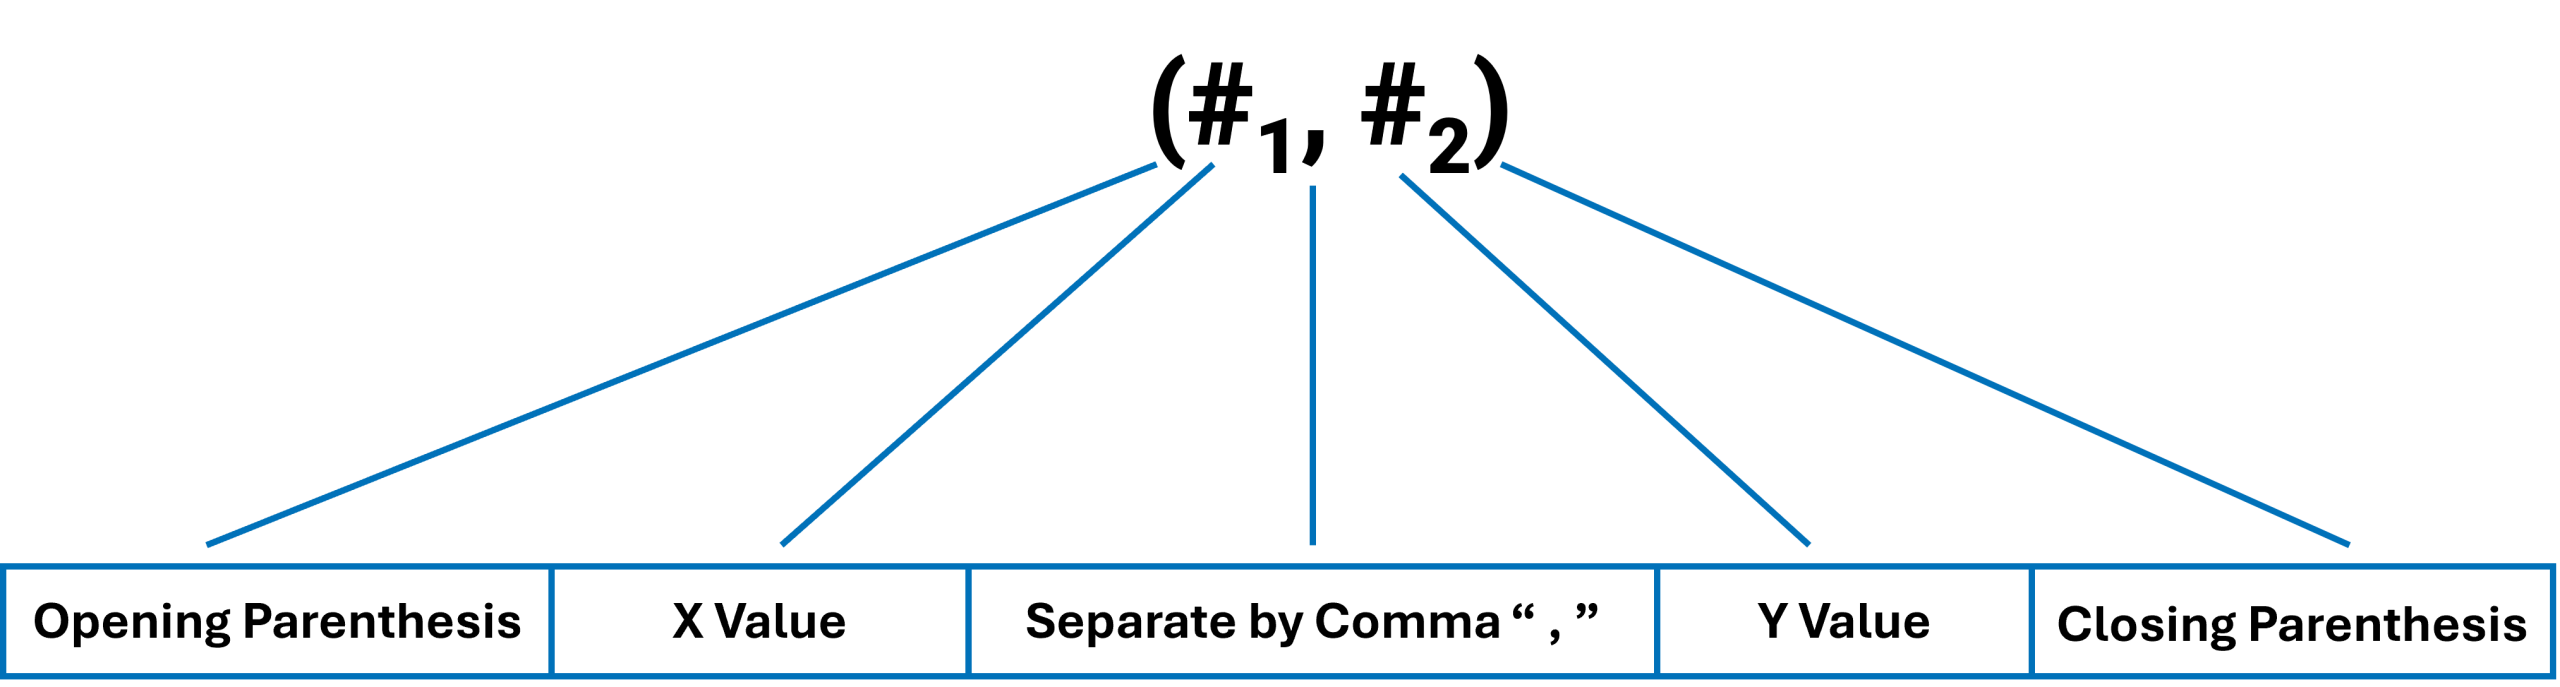
As we can see, when finding the x-intercept, the y-value is always 0. This is the point where the graph touches or crosses the x-axis. When finding the y-intercept, the x-value is always 0, which is when the graph touches or crosses the y-axis.
Example 1.2-3-2: Find the x-intercept(s) and y-intercept.
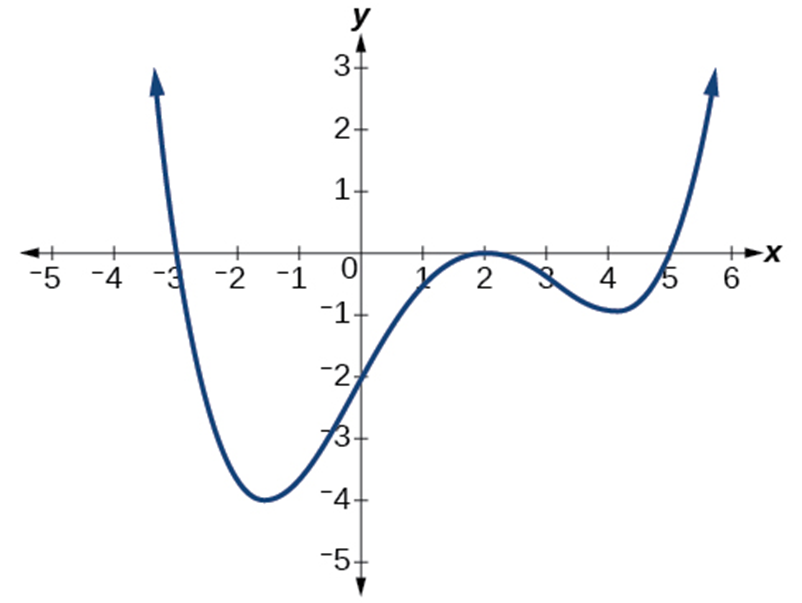
x-intercepts: 3,2,5 at (-3,0),(2,0),(5,0).
y-intercepts: -2 at (0,-2).
To find the x-intercept, we look for the point where the y-value is 0 (i.e., where the graph touches the x-axis). When finding the y-intercept, the x-value is always 0, which is where the graph touches or crosses the y-axis.
