
1.3: Properties of functions
Learning Objectives
- Determine when a function is odd/even/neither from a graph or an equation.
- Determine when a function is increasing, decreasing, or constant from a graph.
- Identify local and absolute extrema (maximums or minimums) from a graph.
Determine a function from a graph
A function whose graph is symmetric about the y-axis is called an even function.
Same y value, but opposite x value.
A function with a graph that is symmetric about the origin is called an odd function.
Opposite y value and opposite x value.
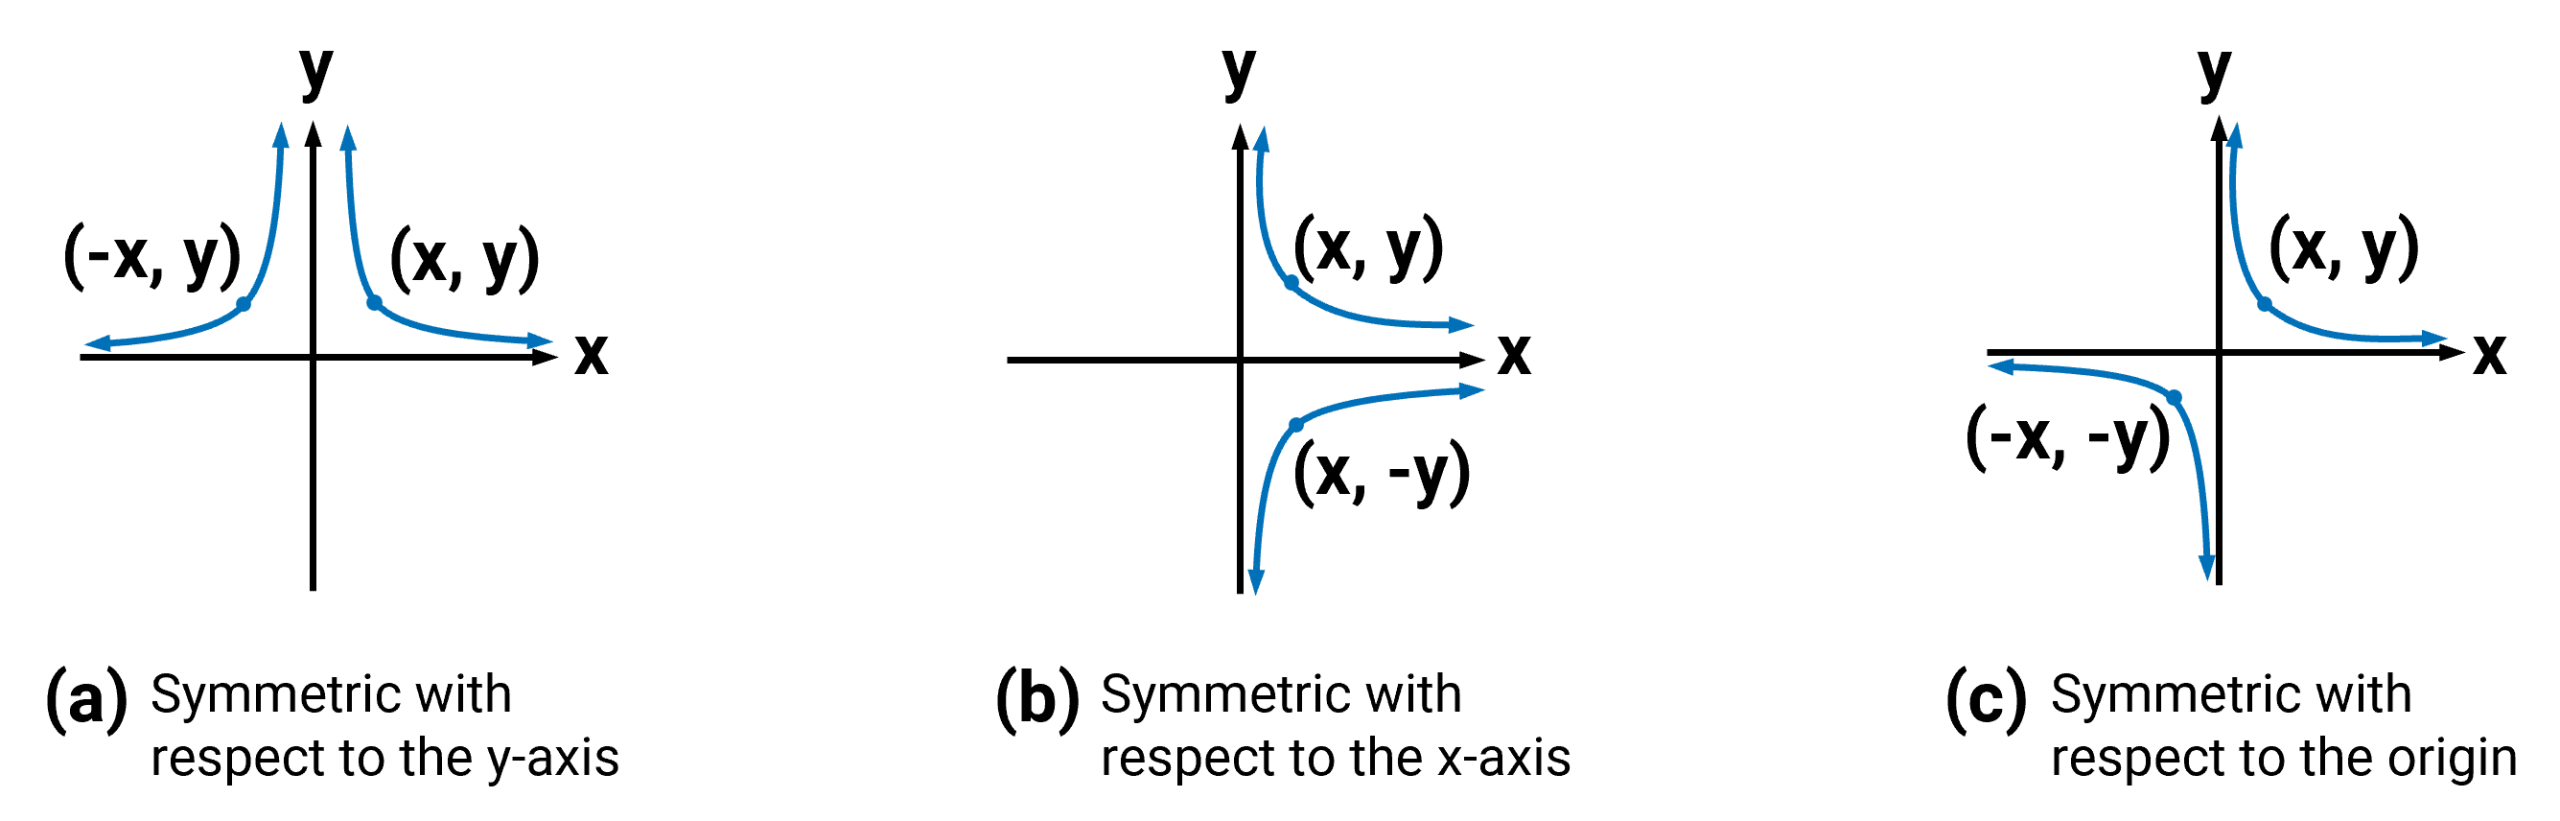

A function can be neither even nor odd if it does not exhibit either symmetry.
For example, [latex]f\left(x\right)=2^x[/latex] is neither even nor odd. Also, the only function that is both even and odd is the constant function [latex]f(x)=0[/latex].
Example 1.3-1-1: Determine if it’s an even or odd function.
 Key
Key
Example 1.3-1-1: Determine if it’s an even or odd function.

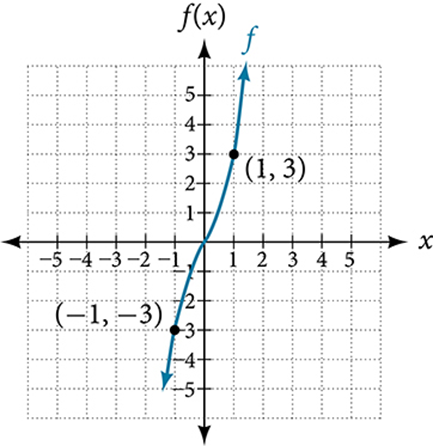
Graph a is an Odd function. The graph is symmetric about the origin. For every point (x, y) on the graph, the corresponding point (−x, −y) is also on the graph. For example, (1, 3) is on the graph of f, and the corresponding point (−1, −3) is also on the graph.
Example 1.3-1-2: Determine if it’s an even or odd function.
Key
Example 1.3-1-2: Determine if it’s an even or odd function.

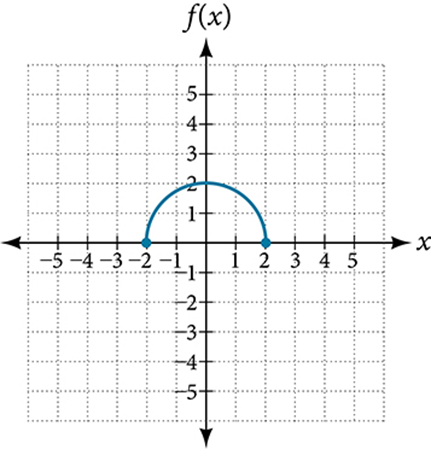
Graph a is an Even function. The graph is symmetric about the y-axis. For every point (x, y) on the graph, the corresponding point (−x, y) is also on the graph. For example, (-2, 0) is on the graph of f, and the corresponding point (2, 0) is also on the graph.
 Your Turn
Practice 1.3-1-1
Determine a function from equation
Given the formula for a function, determine if the function is even, odd, or neither.
Determine whether the function satisfies [latex]f\left(x\right)=f\left(-x\right)[/latex].
If it does, it is even.
Determine whether the function satisfies [latex]f\left(x\right)=-f\left(-x\right)[/latex].
If it does, it is odd.
If the function does not satisfy either rule, it is neither even nor odd.
Example 1.3-1-3: Determine if it’s an even or odd function algebraically.
[latex]f\left(x\right)=3x^2+7[/latex]
Key
Example 1.3-1-3: Determine if it’s an even or odd function algebraically.
[latex]f\left(x\right)=3x^2+7[/latex]
Step1: use [latex]-x[/latex]substitue the [latex]x[/latex]
[latex]f\left(-x\right)=3\left(-x\right)^2+7[/latex]
Step 2: simplify the function
[latex]f\left(-x\right)=3x^2+7[/latex]
Step 3: compare [latex]f(-x)[/latex] with [latex]f(x)[/latex], if [latex]f(x)=f(-x)[/latex] even, if [latex]f(x)=-f(-x)[/latex] odd, other than that, netiher.
Since in this question, [latex]f(x)=f(-x)[/latex], thus it is an even function.
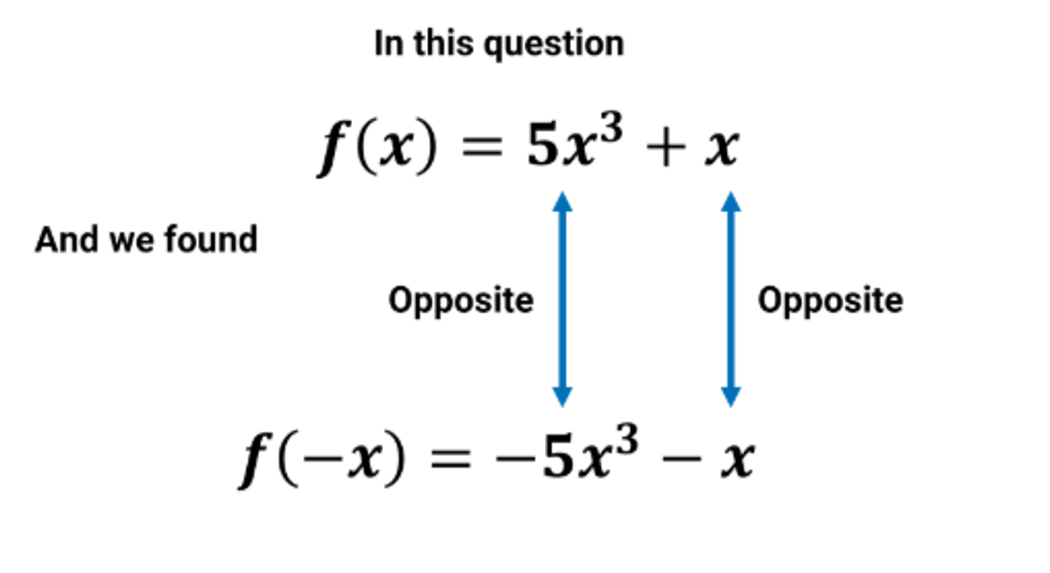
Another way to analyze symmetry is by comparing with [latex]f(x)[/latex] with [latex]f(-x)[/latex] or [latex]-f(-x)[/latex]
After finding [latex]f(-x)[/latex], examine the expression and compare it with the original function [latex]f(x)[/latex]:
- If all terms are the same, the function is even.
- If all terms are the opposite (i.e., the signs are reversed), the function is odd.
- If the expression contains a mix of same and opposite terms, the function is neither even nor odd.

In this question [latex]f\left(x\right)=3x^2+7[/latex]
And we found [latex]f\left(-x\right)=3x^2+7[/latex]
Since both [latex]3x^2[/latex] and +7 terms are the same, thus it is an even function.
Example 1.3-1-4: Determine if it’s an even or odd function algebraically.
[latex]f\left(x\right)=3x^2+2x[/latex]
Key
Example 1.3-1-4: Determine if it’s an even or odd function algebraically.
[latex]f\left(x\right)=3x^2+2x[/latex]
Step1: use [latex]-x[/latex] substitue the [latex]x[/latex]
[latex]f\left(-x\right)=3\left(-x\right)^2+2\left(-x\right)[/latex]
Step 2: simplify the function
[latex]f\left(-x\right)=3x^2-2x[/latex]
Step 3: compare [latex]f(-x)[/latex] with [latex]f(x)[/latex], if [latex]f(x)=f(-x)[/latex]even, if [latex]f(x)=-f(-x)[/latex] odd, other than that, netiher. In this question, [latex]f(x)≠f(-x)[/latex], [latex]f(x)≠-f(-x)[/latex] thus it is it neither.
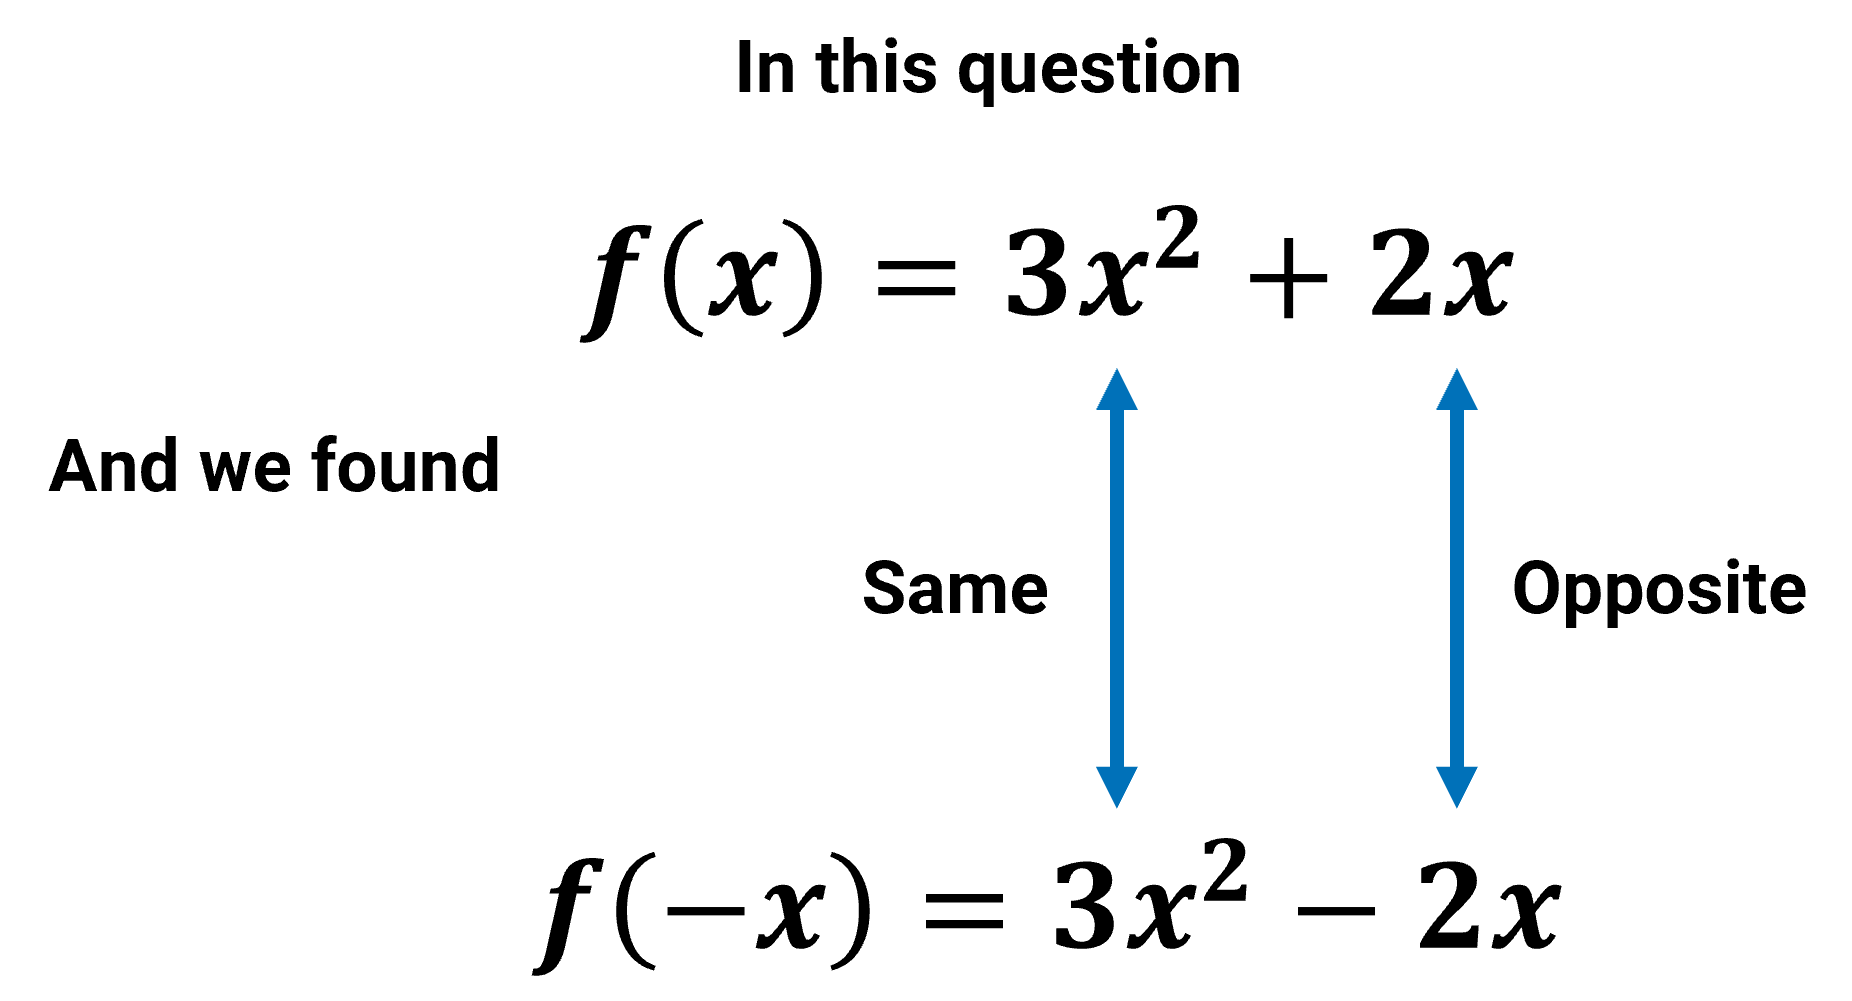
Since both [latex]3x^2[/latex] term is the same, however the second term [latex]+2x[/latex] and [latex]-2x[/latex] are opposite, thus it is neither.
Example 1.3-1-5: Determine if it’s an even or odd function algebraically.
[latex]f\left(x\right)=5x^3+x[/latex]
Key
Example 1.3-1-5: Determine if it’s an even or odd function algebraically.
[latex]f\left(x\right)=5x^3+x[/latex]
Step1: use [latex]-x[/latex] substitue the [latex]x[/latex]
[latex]f\left(-x\right)=5\left(-x\right)^3+\left(-x\right)[/latex]
Step 2: simplify the function
[latex]f\left(-x\right)=-5x^3-x[/latex]
Step 3: compare [latex]f(-x)[/latex] with [latex]f(x)[/latex], if [latex]f(x)=f(-x)[/latex] even, if [latex]f(x)=-f(-x)[/latex] odd, other than that, netiher. In this question, [latex]f(x)≠f(-x)[/latex], but [latex]f(x)=-f(-x)[/latex] thus it is an odd function.
Since both terms are opposite, thus it is odd.
Your Turn
Practice 1.3-1-2
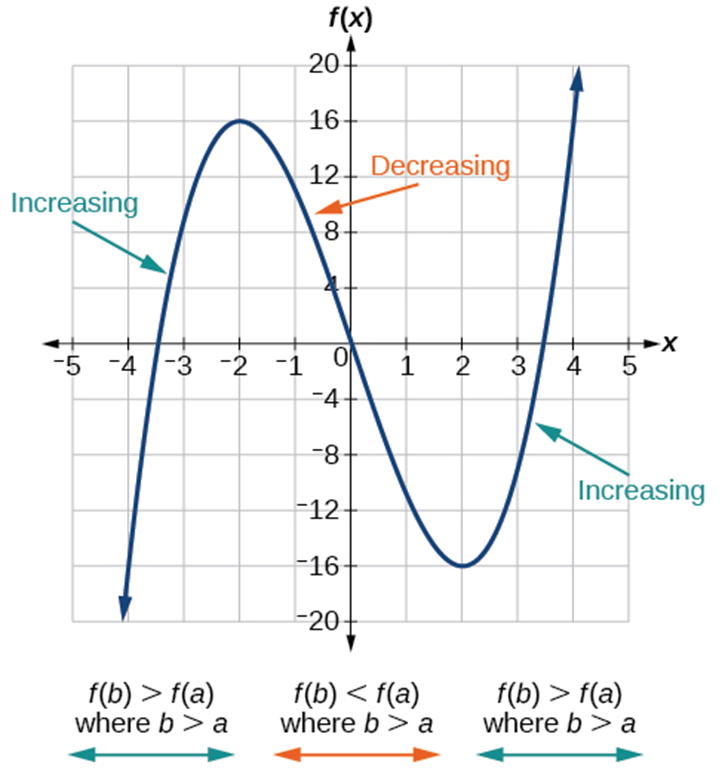
Determine increasing, decreasing, or constant from a graph.
A function [latex]f[/latex] is increasing function on an open interval [latex]I[/latex] if[latex]b>a[/latex] and [latex]f(b)>f(a)[/latex].
A function [latex]f[/latex] is decreasing function on an open interval [latex]I[/latex] if [latex]b>a[/latex] and [latex]f(b)
 |
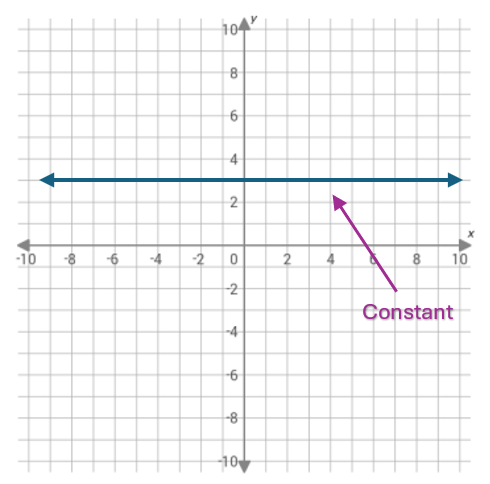
Constant function [latex]b>a[/latex] where [latex]f(b)=f(a)[/latex]. |
Example 1.3-2-1:
Determine the interval(s) on which the function is increasing, decreasing and constant. Use interval notation, if you can’t find it, put N/A.
Key
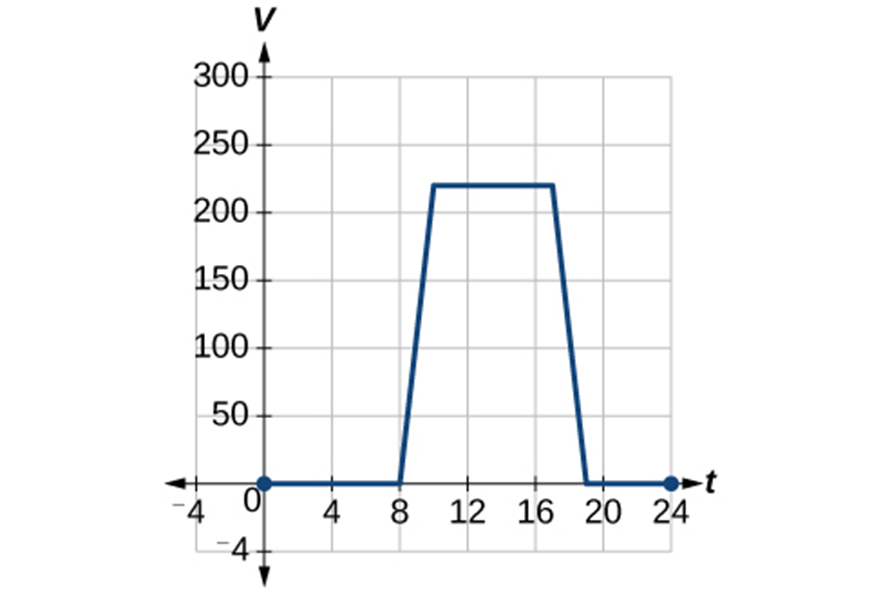
Example 1.3-2-1: Determine the interval(s) on which the function is increasing, decreasing and constant. Use interval notation, if you can’t find it, put N/A.
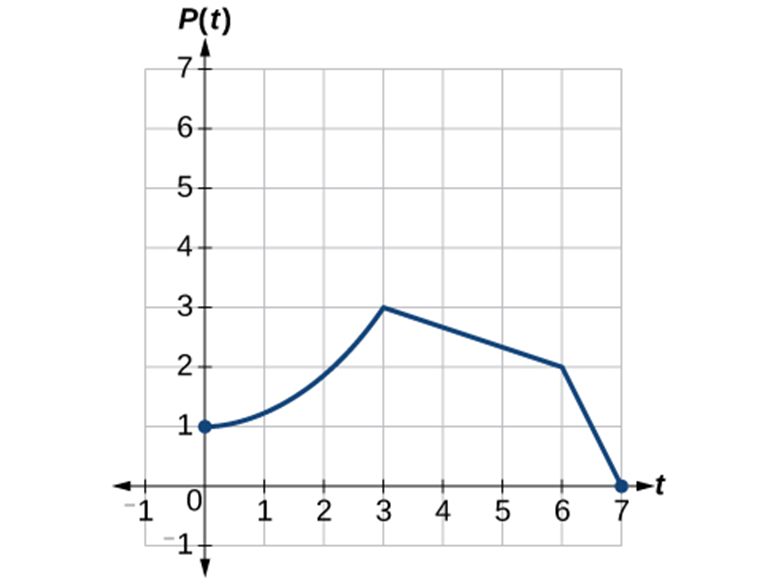
Increasing: (0,3)
Decreasing: (3,7)
Constant: N/A
Note: Do not use brackets. Even though this graph shows a closed point, when we determine where a function is increasing, decreasing, or constant, we only consider open intervals. Therefore, use parentheses only.
Your Turn
Practice 1.3-2-1
Identify local and absolute maximums and minimums
| Term | Definition | Analogy |
|---|---|---|
| Local Maximum | A function has a local maximum at a point b if the value at b is higher than all nearby points. | Hill |
| Local Minimum | A function has a local minimum at a point b if the value at b is lower than all nearby points. | Valley |
| Absolute Maximum | A function has an absolute maximum at [latex]x = c[/latex] if [latex]f(c)[/latex] is the greatest value the function ever reaches. This means [latex]f(c) ≥ f(x)[/latex] for every x in the domain. | The Highest Point |
| Absolute Minimum | A function has an absolute minimum at [latex]x = d[/latex] if [latex]f(d)[/latex] is the smallest value the function ever reaches. This means [latex]f(d) ≤ f(x)[/latex] for every x in the domain. | The Lowest Point |
Example 1.3-3-1: Use the graphed function to answer the following questions.
- Use the graph find local maximum.
- Use the graph find local minimum.
- Use the graph find absolute maximum.
- Use the graph find absolute minimum.
Key
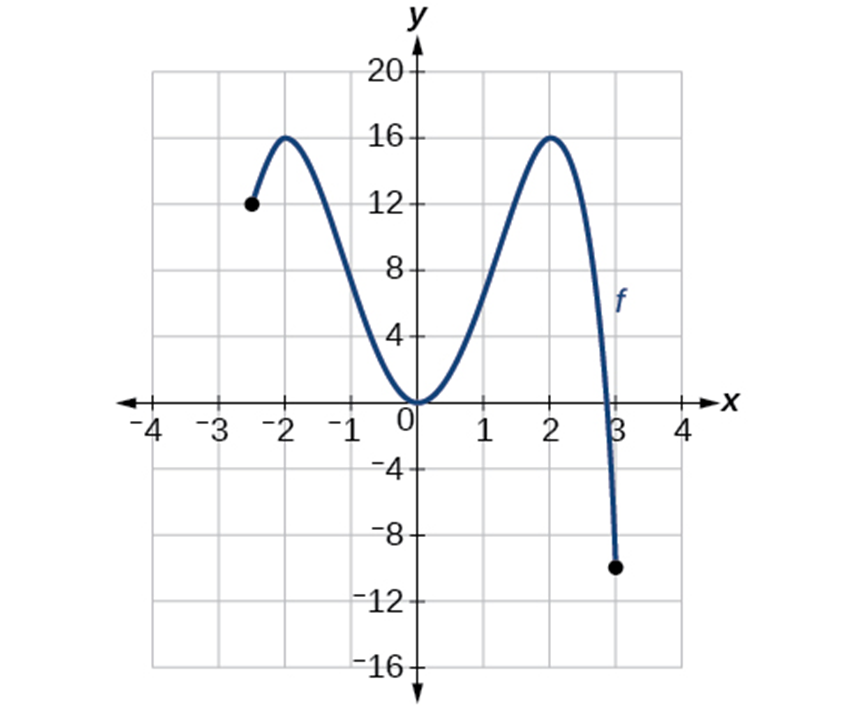
Example 1.3-3-1: Use the graphed function to answer the following questions.
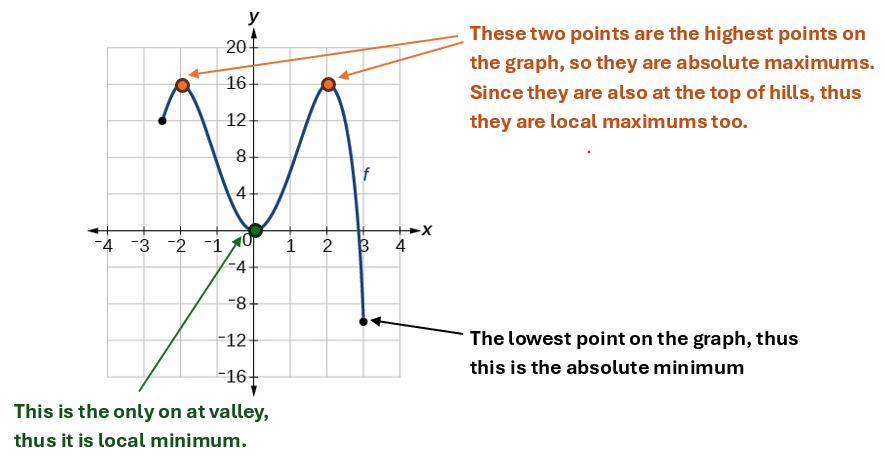
- Local maximum: 16
- Local minimum: 0
- Absolute maximum: 16
- Absolute minimum: -10
Example 1.3-3-2: Use the graphed function to answer the following questions.
- Use the graph find local maximum.
- Use the graph find local minimum.
- Use the graph find absolute maximum.
- Use the graph find absolute minimum.
Key
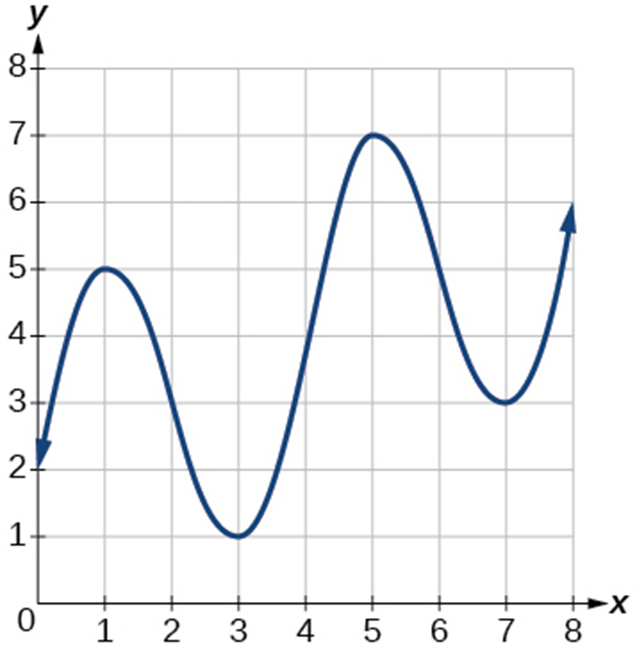
Example 1.3-3-2: Use the graphed function to answer the following questions.
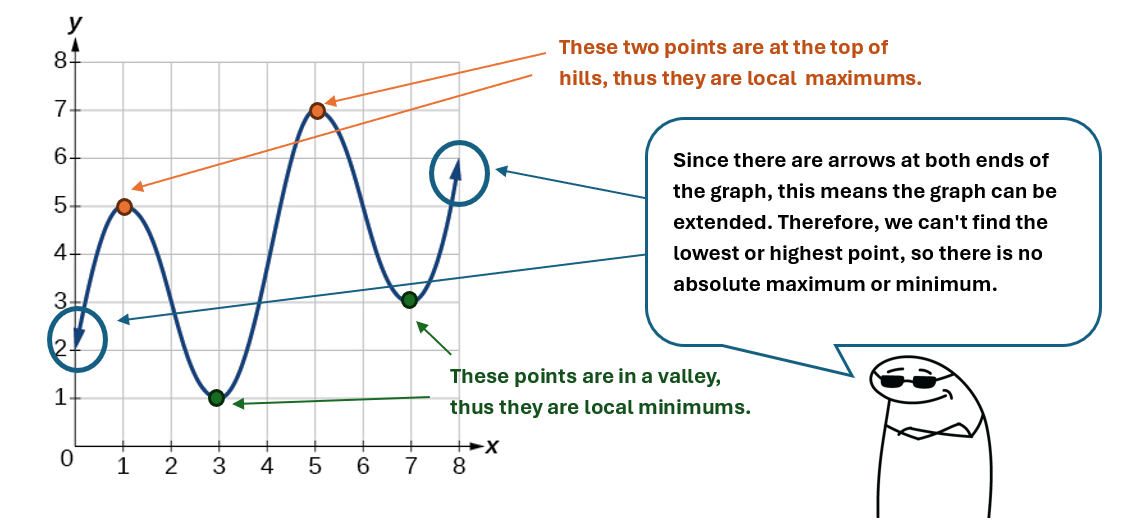
- Local maximum: 5, 7
- Local minimum: 1, 3
- Absolute maximum: N/A
- Absolute minimum: N/A
Your Turn
Practice 1.3-3-1
Practice 1.3-3-2
Licenses and Attribution
CC Licensed Content
- Precalculus-2e by Jay Abramson is licensed CC BY. Access for free.
