
3.2: One-to-One Functions; Inverse Functions
Learning Objectives
- Determine when a function is one-to-one.
- Find the inverse of a function.
- Determine if a pair of functions are inverses.
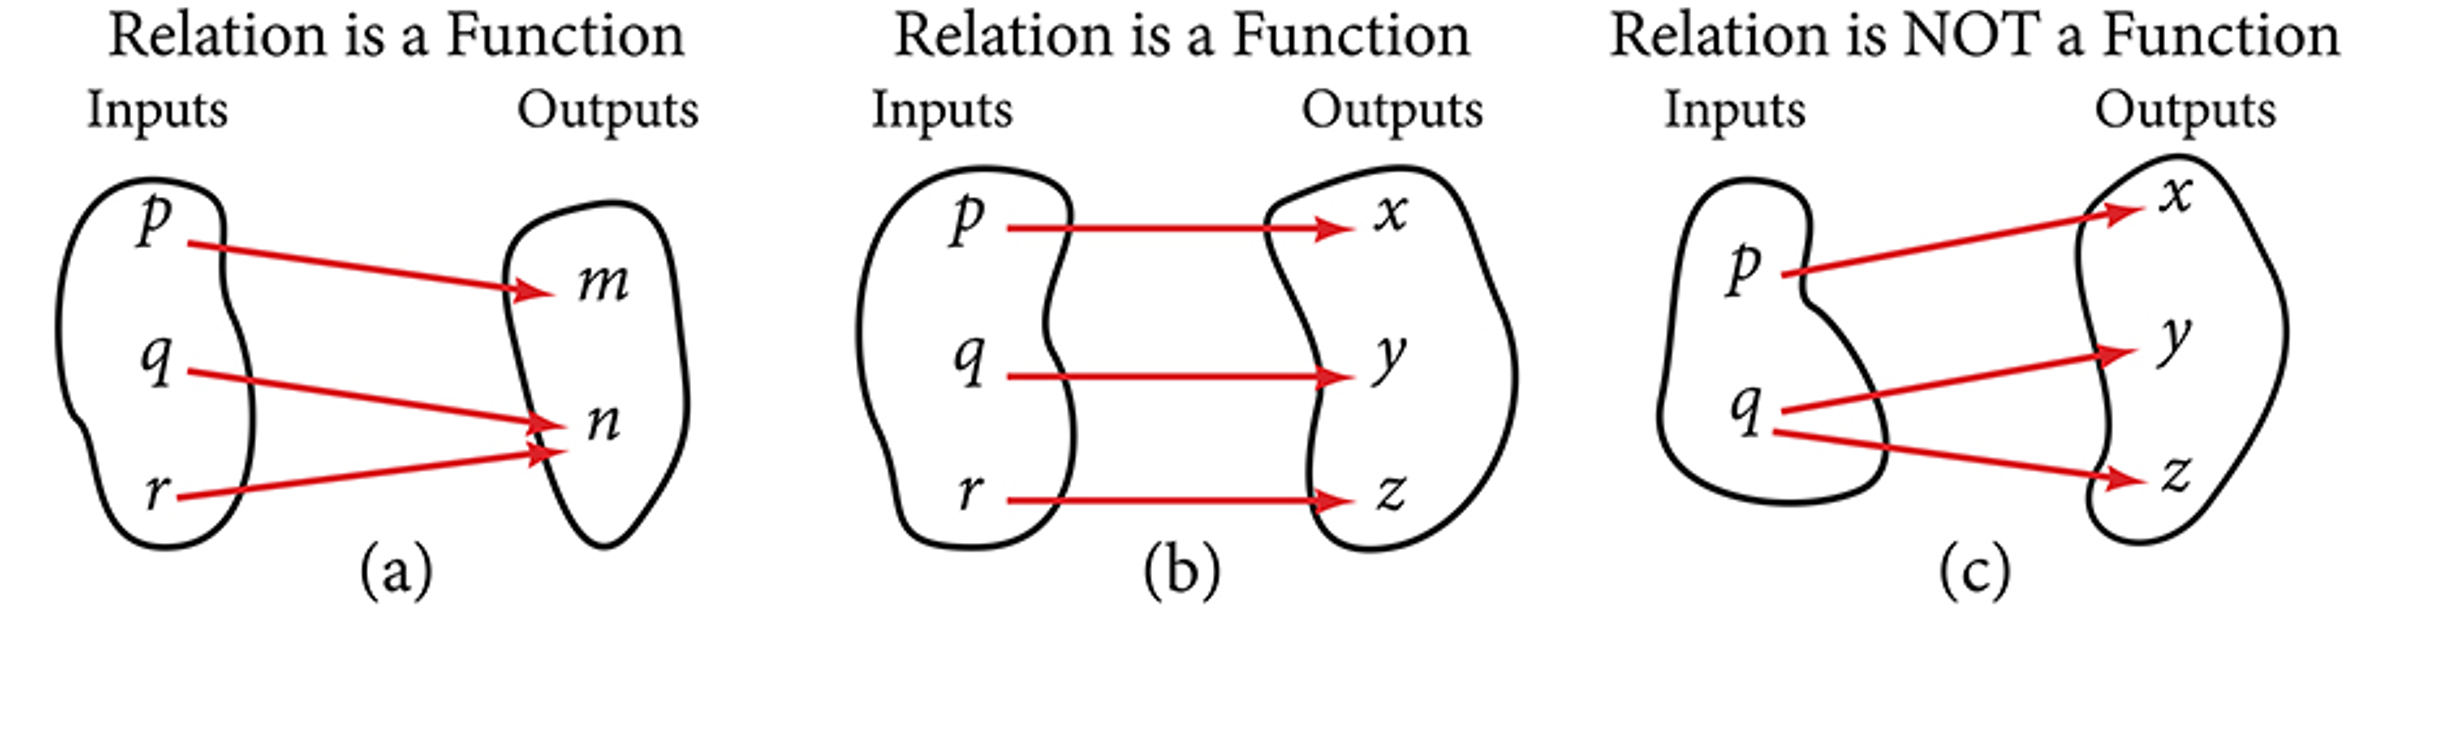
One-to-one Function
A function is one-to-one if any two different inputs in the domain correspond to two different outputs in the range. That is, if [latex]x_1[/latex]and [latex]x_2[/latex] are two different inputs of a function [latex]f[/latex], then [latex]f[/latex] is one-to-one if [latex]f\left(x_1\right)\neq f\left(x_2\right)[/latex]
In a graph, a one-to-one function must pass both the vertical line test and the horizontal line test.”
Explanation:
- Vertical Line Test: This test determines if a graph represents a function.
- Horizontal Line Test: This test checks if a function is one-to-one.
Note: it must pass both tests.
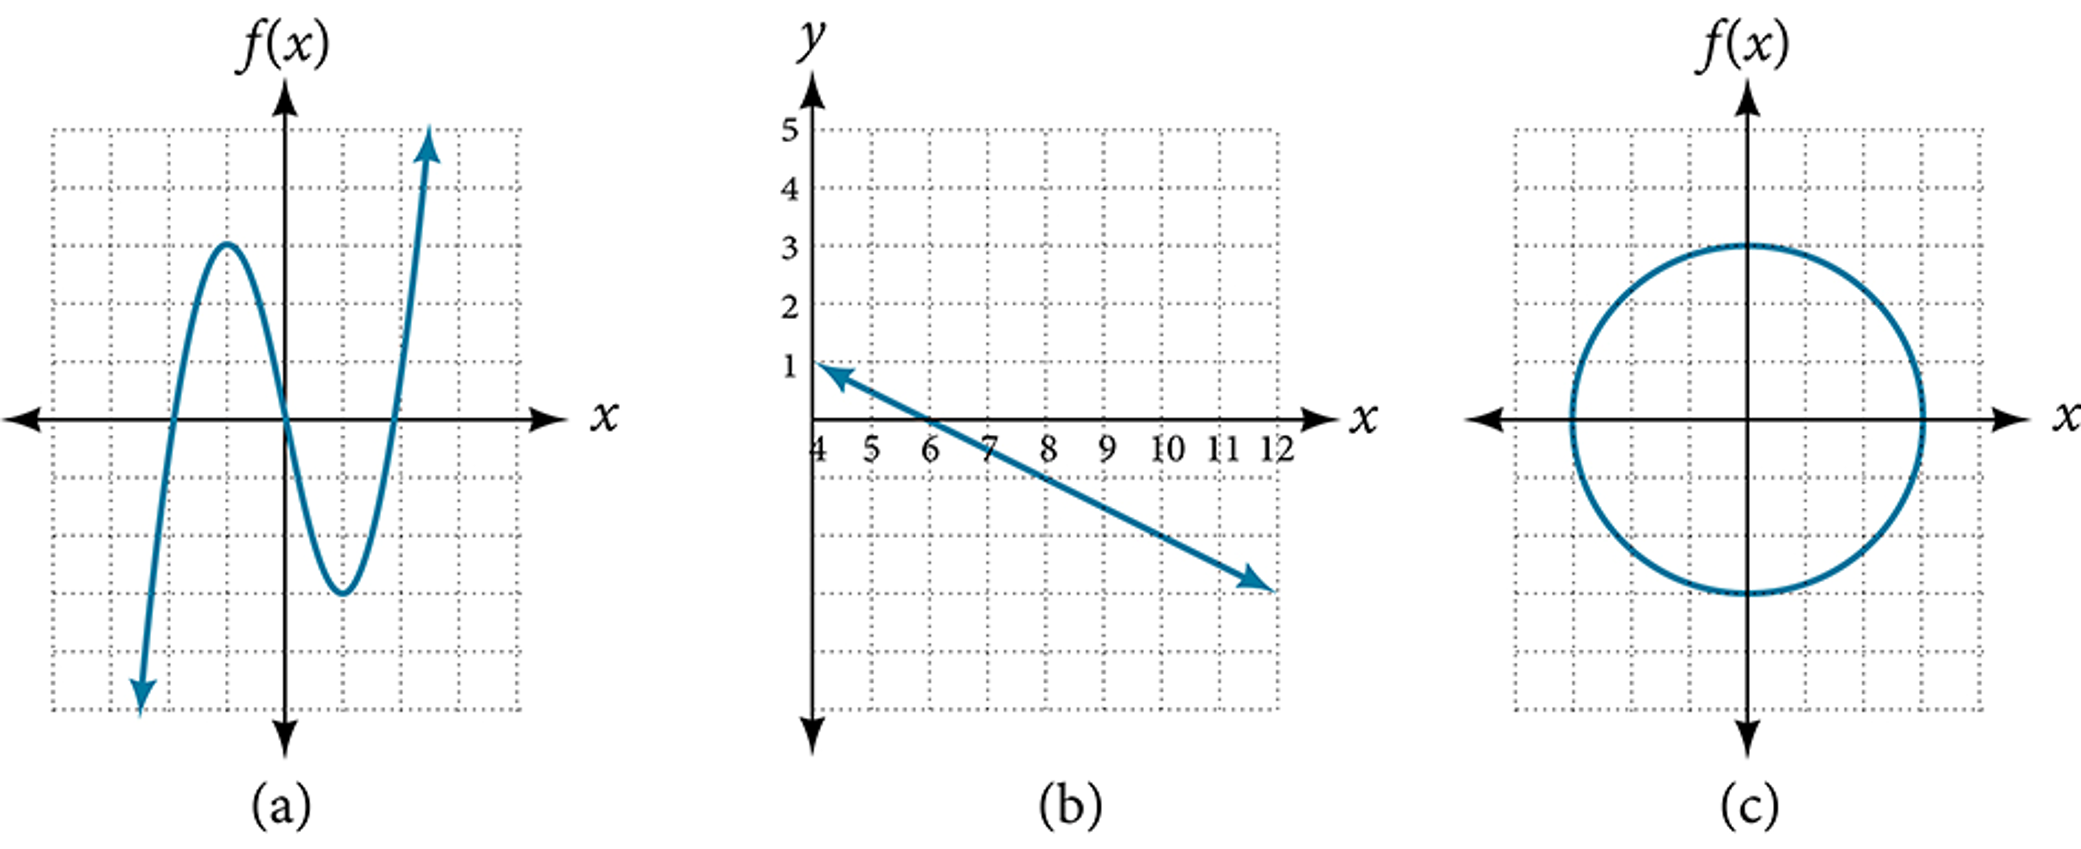
Example 3.2-1-1: Identify if the graph is one to one function.
 Key
Key
Example 3.2-1-1: Identify if the graph is one to one function.
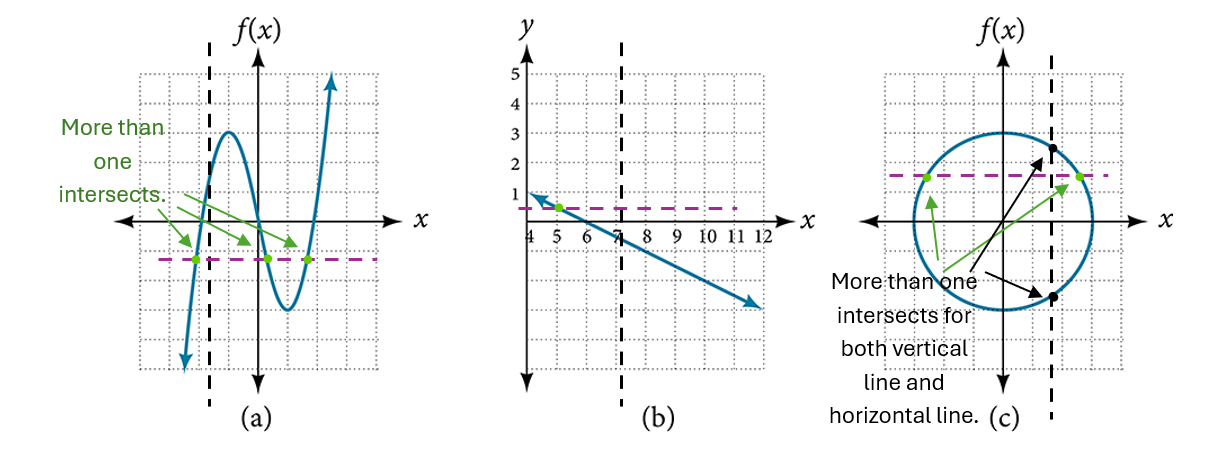
- Function passes vertical line test, NOT one-to-one function, DID NOT passes horizontal line test.
- Function passes vertical line test, one-to-one function, passes horizontal line test.
- Not a function
 Your Turn
Practice 3.2-1-1
Inverse of a function
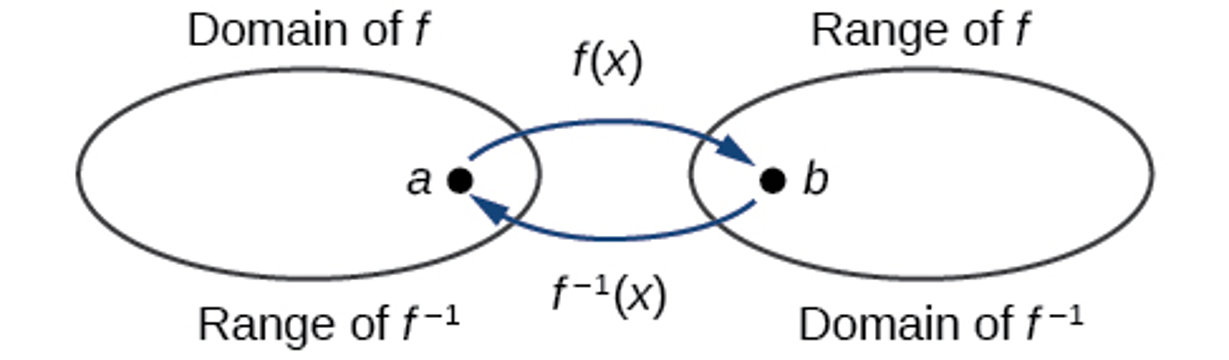
For any one-to-one function [latex]f\left(x\right)=y[/latex], a function [latex]f^{-1}\left(x\right)[/latex] is an inverse function of [latex]f[/latex] if [latex]f^{-1}\left(y\right)=x[/latex]. This can also be written as [latex]f^{-1}\left(f\left(x\right)\right)=x[/latex] for all [latex]x[/latex] in the domain of [latex]f[/latex]. It also follows that [latex]f\left(f^{-1}\left(x\right)\right)=x[/latex] for all [latex]x[/latex] in the domain of [latex]f^{-1}[/latex] if [latex]f^{-1}[/latex] is the inverse of [latex]f[/latex].
The notation [latex]f^{-1}[/latex] is read “[latex]f[/latex] inverse.” Like any other function, we can use any variable name as the input for [latex]f^{-1}[/latex], so we will often write [latex]f^{-1}\left(x\right)[/latex], which we read as “[latex]f[/latex] inverse of [latex]x[/latex]“. Keep in mind that
[latex]f^{-1}\left(x\right)\neq\frac1{f\left(x\right)}[/latex]
and not all functions have inverses.
If [latex]f[/latex] has its inverse function [latex]f^{-1}[/latex], then the domain of [latex]f[/latex] is the range of [latex]f^{-1}[/latex], the range of [latex]f[/latex] is the domain of [latex]f^{-1}[/latex].
To find inverse function:
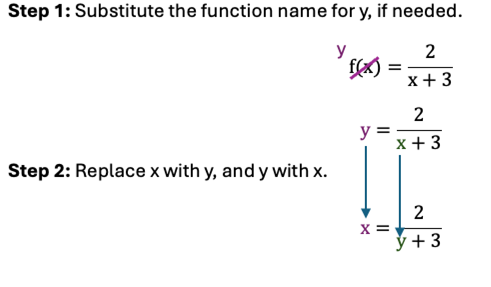
Step 1: Substitute the function name for [latex]y[/latex], if needed.
Step 2: Replace [latex]x[/latex] with [latex]y[/latex], and [latex]y[/latex] with [latex]x[/latex].
Step 3: Isolate [latex]y[/latex].
Step 4: use [latex]f^{-1}[/latex] substitute the [latex]y[/latex].
Example 3.2-2-1: Identify the domain and range of the given function. Then, find its inverse function and determine the domain and range of the inverse.
[latex]f\left(x\right)=\frac2{x+3}[/latex]
Key
Example 3.2-2-1: Identify the domain and range of the given function. Then, find its inverse function and determine the domain and range of the inverse.
[latex]f\left(x\right)=\frac2{x+3}[/latex]
Domain of [latex]f\left(x\right)=\frac2{x+3}[/latex]
[latex]x+3\neq0[/latex]
[latex]x\neq-3[/latex]
Range of [latex]f\left(x\right)=\frac2{x+3}[/latex]
Since [latex]x\neq-3[/latex] thus [latex]y\neq0[/latex]
Inverse function of [latex]f\left(x\right)=\frac2{x+3}[/latex]
Step 3: Isolate [latex]y[/latex].
[latex]x=\frac2{y+3}[/latex]
[latex]\left(y+3\right)x=\frac2{y+3}\left(y+3\right)[/latex]
[latex]xy+3x=2[/latex]
[latex]xy=2-3x[/latex]
[latex]y=\frac{2-3x}x[/latex]
Step 4: use [latex]f^{-1}[/latex] substitute the [latex]y[/latex].
[latex]f^{-1}\left(x\right)=\frac{2-3x}x \left(Replace\;y\;by\;f^{-1}\left(x\right)\right)[/latex]
Domain of the inverse function
[latex]f^{-1}\left(x\right)\;is\;x\neq0[/latex] (range of the original function)
Range of the inverse function
[latex]f^{-1}\left(x\right)\;is\;y\neq-3[/latex] (domain of the original function)
Your Turn
Practice 3.2-2-1
Determine if a pair of functions are inverses
Given two functions [latex]f\left(x\right)[/latex] and [latex]g\left(x\right)[/latex], test whether the functions are inverses of each other.
- Determine whether [latex]f\left(g\left(x\right)\right)=x[/latex] or [latex]g\left(f\left(x\right)\right)=x[/latex].
- If either statement is true, then both are true, and [latex]g=f^{-1}[/latex] and [latex]f=g^{-1}[/latex]. If either statement is false, then both are false, and [latex]g\neq f^{-1}[/latex] and [latex]f\neq g^{-1}[/latex].
Example 3.2-3-1: Testing Inverse Relationships Algebraically
If [latex]f\left(x\right)=\frac1{x+2}[/latex] and [latex]g\left(x\right)=\frac1x-2[/latex], is [latex]g=f^{-1}[/latex]?
Key
Example 3.2-3-1: Testing Inverse Relationships Algebraically
If [latex]f\left(x\right)=\frac1{x+2}[/latex] and [latex]g\left(x\right)=\frac1x-2[/latex], is [latex]g=f^{-1}[/latex]?
[latex]g\left(f\left(x\right)\right)=\frac1{\left({\displaystyle\frac1{x+2}}\right)}-2[/latex]
[latex]=x+2-2[/latex]
[latex]=x[/latex]
We must also verify the other formula.
[latex]f\left(g\left(x\right)\right)=\frac1{{\displaystyle\frac1x}-2+2}[/latex]
[latex]=\frac1{\displaystyle\frac1x}[/latex]
[latex]=x[/latex]
so
[latex]g=f^{-1}[/latex] and [latex]f=g^{-1}[/latex]
 Analysis
Notice the inverse operations are in reverse order of the operations from the original function.
